Figure 4.
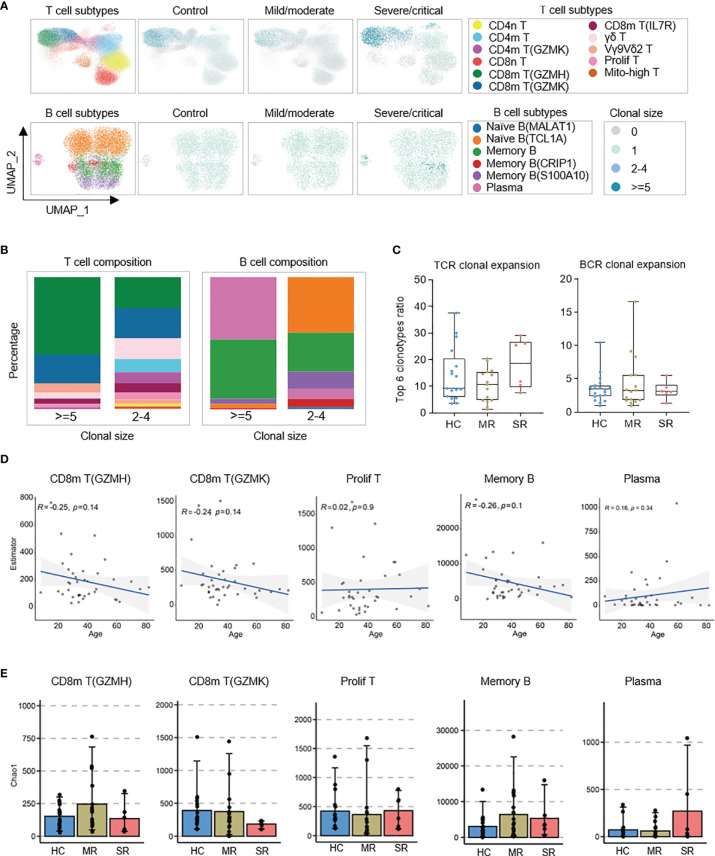
Distribution of BCR/TCR expanded clonotypes and associations of patient age and COVID-19 severity with the diversity of B and T cell repertoires. (A) UMAPs embedding of T/B cells colored by the density of cells characterized by different clonal expansion sizes (n = 1, n = 2-4, and n > = 5). Shown separately in different COVID-19 severity. (B) Column charts of T/B cell subpopulation composition of expanded TCR/BCR clones. (C) Box plots show characterization and comparison of TCR clonal expansion among severe/critical recovered patients (SR), mild/moderate recovered patients (MR), and healthy controls (HC), by quantifying the ratio of expanded clones. (D) The correlation analysis charts show the correlation between patient age and the BCR/TCR diversity of CD8m T(GZMH), CD8m T(GZMK), Prolif T, Memory B, and Plasma (Spearman’s correlation). (E) Box plots show the BCR/TCR diversity of CD8m T(GZMH), CD8m T(GZMK), Prolif T, Memory B, and Plasma among severe/critical recovered patients (SR), mild/moderate recovered patients (MR), and healthy controls (HC). The chao1 method in R-package Immunarch was used to evaluate repertoire diversity.

