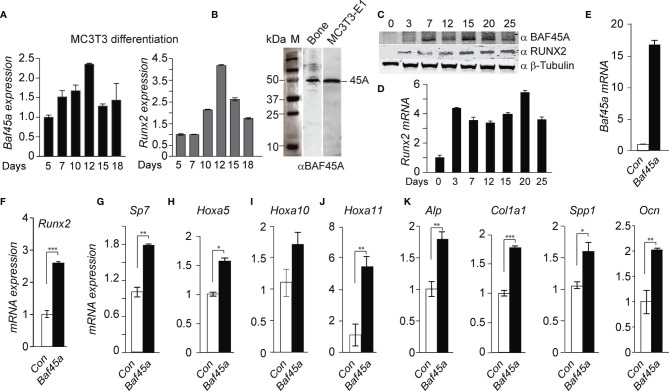
Figure 2.
Baf45a expression levels induce gene expression profiles for osteoblast differentiation. (A) Relative expression levels of Baf45a (left panel) and Runx2 (right panel) were obtained by real-time RT-qPCR using DNase I treated total RNA isolated from murine preosteoblast MC3T3-E1 cells induced to differentiate for 18 days. Gapdh mRNA profile was used as an experimental control. (B) Representative Western blot analysis with anti-BAF45A antibody of lysates from the femur and MC3T3-E1 cells. Molecular weight markers were indicated in kDa. (C) Relative protein levels of BAF45A (upper panel) and RUNX2 (middle panel) were obtained by Western blot analysis using total cell lysate isolated from murine calvarial osteoblast cells induced to differentiate for 25 days. Beta Tubulin protein profile (lower panel) was used as loading control. (D) Relative expression levels of Runx2 were obtained by real-time RT-qPCR using DNase I treated total RNA isolated from murine calvarial cells induced to differentiate for 25 days. (E) Overexpression of Baf45a in MC3T3-E1 osteoblast cells normalized to Gapdh after 72 hours by RT-qPCR. (F–J) Expressions of Runx2, Sp7 (osterix) osterix, Hoxa5, Hoxa10, and Hoxa11 were assessed by RT-qPCR and normalized to Gapdh. (J) Early markers Alp and Col1A1 and (K) late markers Spp1(Opn), and Ocn were assayed. Statistical significance was determined by Student’s t-test (*P ≤ 0.05; **P ≤ 0.01; ***P ≤ 0.001 versus matched control). Gapdh expression was used as the control.

