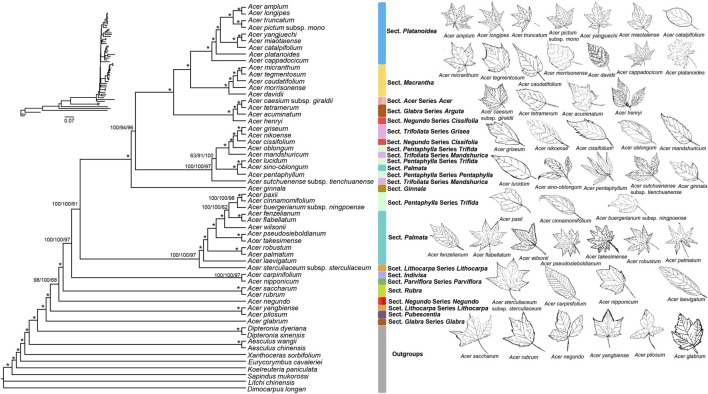
FIGURE 4.
Phylogenetic tree of 48 Acer species inferred by Bayesian Inference (BI), Maximum Likelihood (ML) and Maximum Parsimony (MP) methods, based on the whole cp genome sequences. The numbers above the branches are the posterior probabilities of BI and bootstrap values of ML and MP. Asterisks represent nodes with maximal support values in all methods. Each Section was marked in the same colour.

