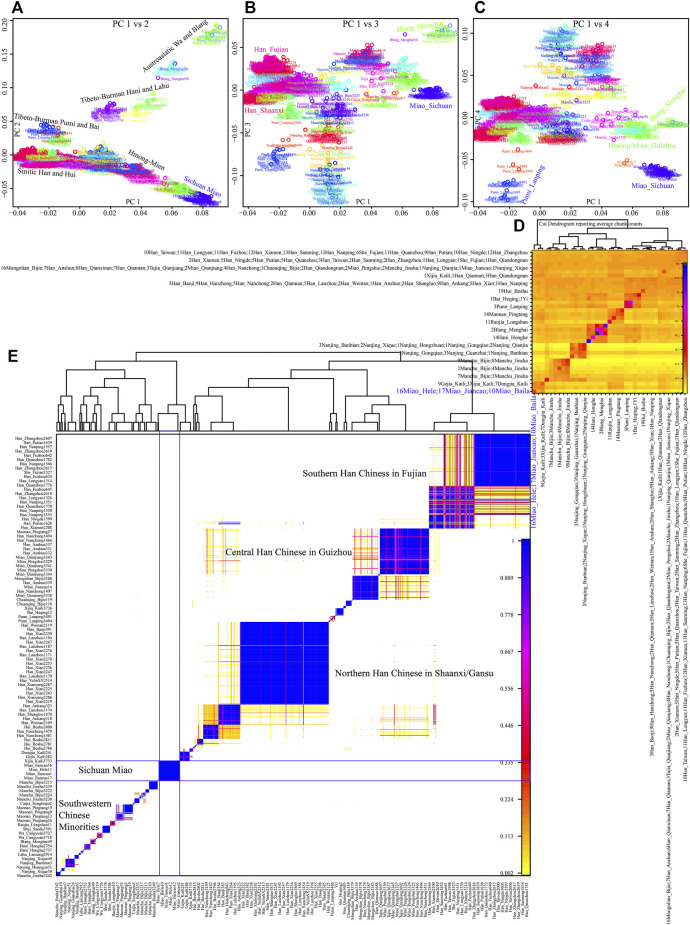
FIGURE 3.
Fine-scale population genetic structure based on the shared haplotype data. (A–C) PCA results based on the coancestry matrix showed a genetic relationship among modern East Asians. The color showed the re-classification of the homogenous population label. (D,E) Clustering patterns of individual-level and population-level East Asians based on the pairwise coincidence matrixes.

