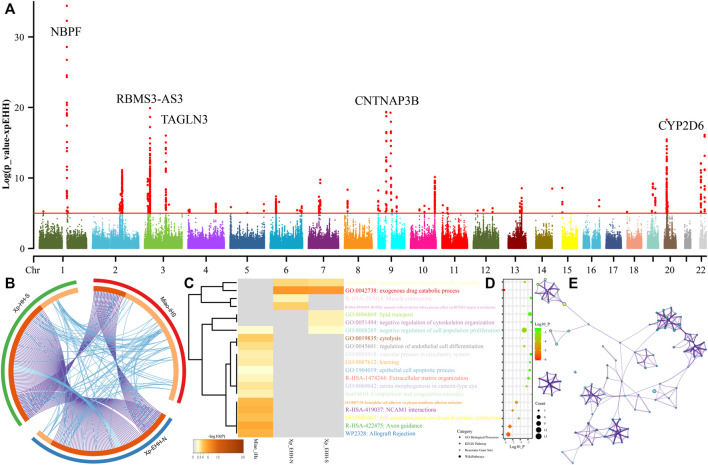
FIGURE 8.
Manhattan showed the natural selection signatures and enrichment analysis. (A) p-values of XPEHH in the Miao population using northern Han as the reference population. (B) Overlap among three gene lists based on gene-level and shared-term level, where blue curves link genes that belong to the same enriched ontology term. The inner-circle represents gene lists, where hits are arranged along the arc. Genes that hit multiple lists are colored in dark orange, and genes unique to a list are shown in light orange. (C) Heatmap of top twenty enriched terms across three input gene lists, colored by p-values. (D) Top 20 clusters with their representative enriched terms. (E) Network of enriched terms colored by cluster-ID.

