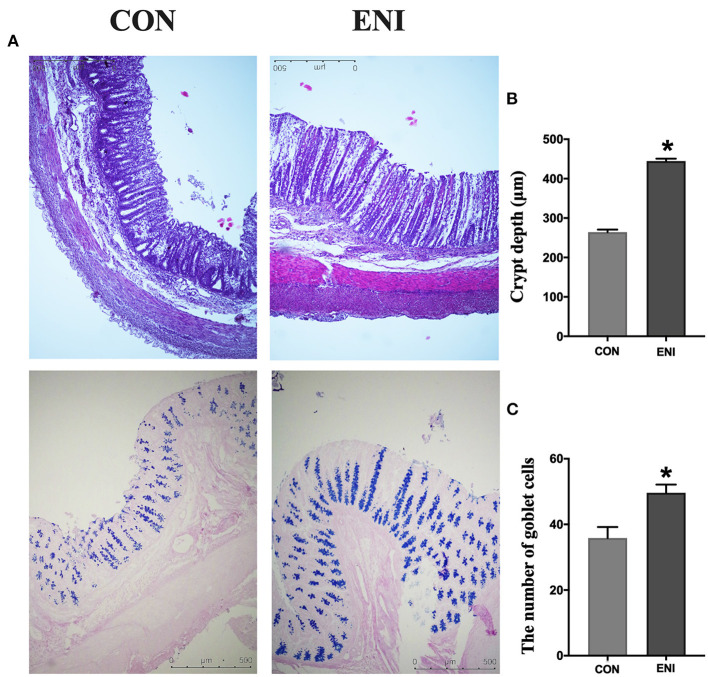
Figure 3.
Effects of early-life nutrition interventions on the morphology of the colon and the number of goblet cells. CON, control group, ENI, early-life nutrition interventions group. (A). HE and PAS staining of colon tissue. (B) The crypt depth of the colon. (C) The number of goblet cells of the colon. Data are expressed as mean ± SEM (n = 4). The independent-samples t-test was used to compare data between two groups. *P < 0.05.

