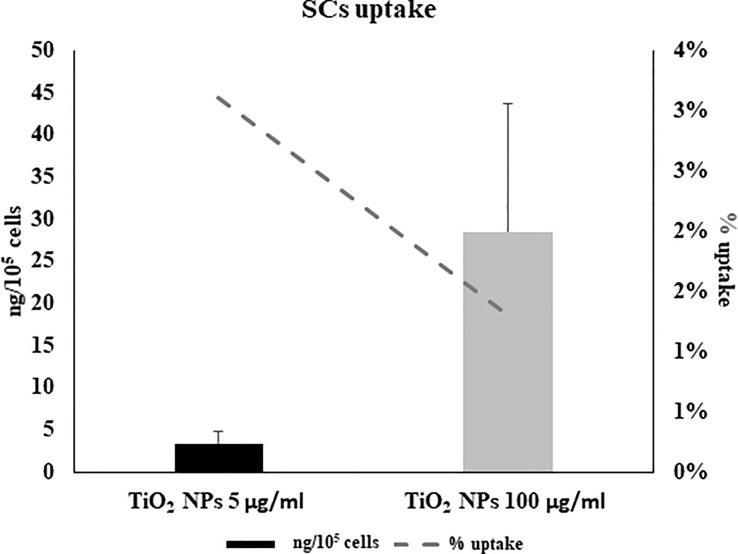
Figure 4.
Cellular uptake by inductively coupled plasma-optical emission spectrometry (ICP-OES). Percentage of internalized nanoparticles (dotted grey line) and amount of metal adsorbed per cell number (expressed as ng/105) in SCs 5 h of incubation with TiO2 NPs 5 (black bar) and 100 µg/ml (grey bar) evaluated by ICP-OES analysis. Data represented as mean ± SEM of three independent experiments, each are performed in triplicate.

