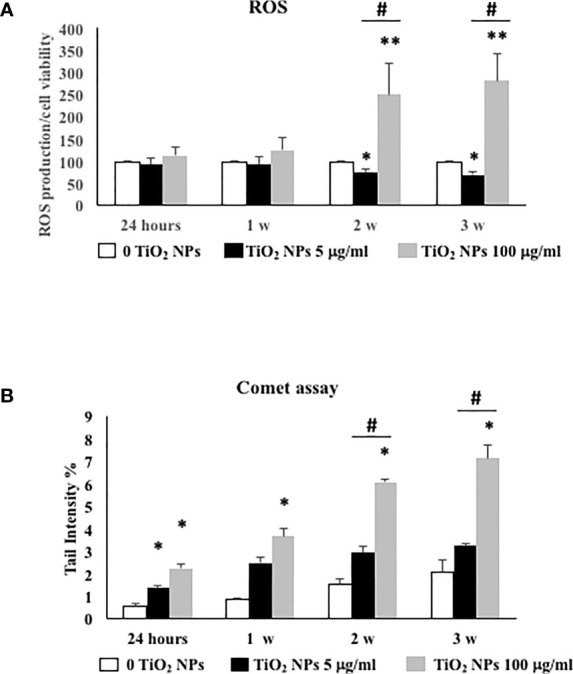
Figure 6.

ROS production and DNA damage under TiO2 NPs treatment in SCs. (A) Total intracellular ROS production in SCs exposed to TiO2 NPs 5 (black bar) and 100 µg/ml (grey bar) for 24 h and 1, 2, and 3 weeks. Data represent the mean ± SEM (* p < 0.05, ** p < 0.001, with respect to unexposed SCs (black dotted line) and # p < 0.05 vs. 5 μg/ml of TiO2 NPs of three independent experiments, n = 8). (B) DNA damage expressed as tail intensity % in unexposed SCs (white bar) and exposed to TiO2 NPs 5 (black bar) and 100 µg/ml (grey bar) for 24 h and 1, 2, and 3 weeks. Data represent the mean ± SEM (* p < 0.05, ** p < 0.001 vs. unexposed SCs and # p < 0.05 vs. 5 μg/ml of TiO2 NPs of three independent experiments, n = 8).
