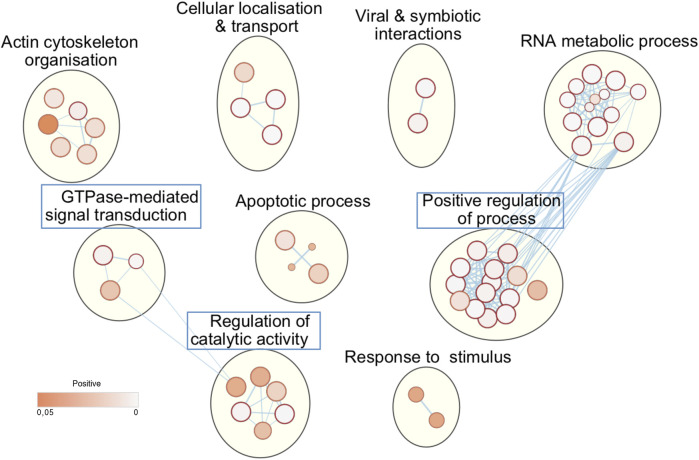
FIGURE 2.
L-CK1.2 targeted biological processes. Functional enrichment analysis of the whole dataset was performed using the g:profiler web server. Results were visualized using the EnrichmentMap plugin of the Cytoscape software package, with a p-value and a Q-value above 0.05 and an edge cut-off of 0.528. Node colour represents the enrichment p-value. Node size is proportional to the total number of genes belonging to the corresponding gene-set. The edge corresponds to the Annotation shared between two nodes (blue), with edge thickness corresponding to the number of shared genes. Node clusters were identified and annotated by the AutoAnnotate plugin of cytoscape. See Supplementary Table S3 for the whole list of annotations. Blue rectangle indicates the biological processes that are specific of L-CK1.2.

