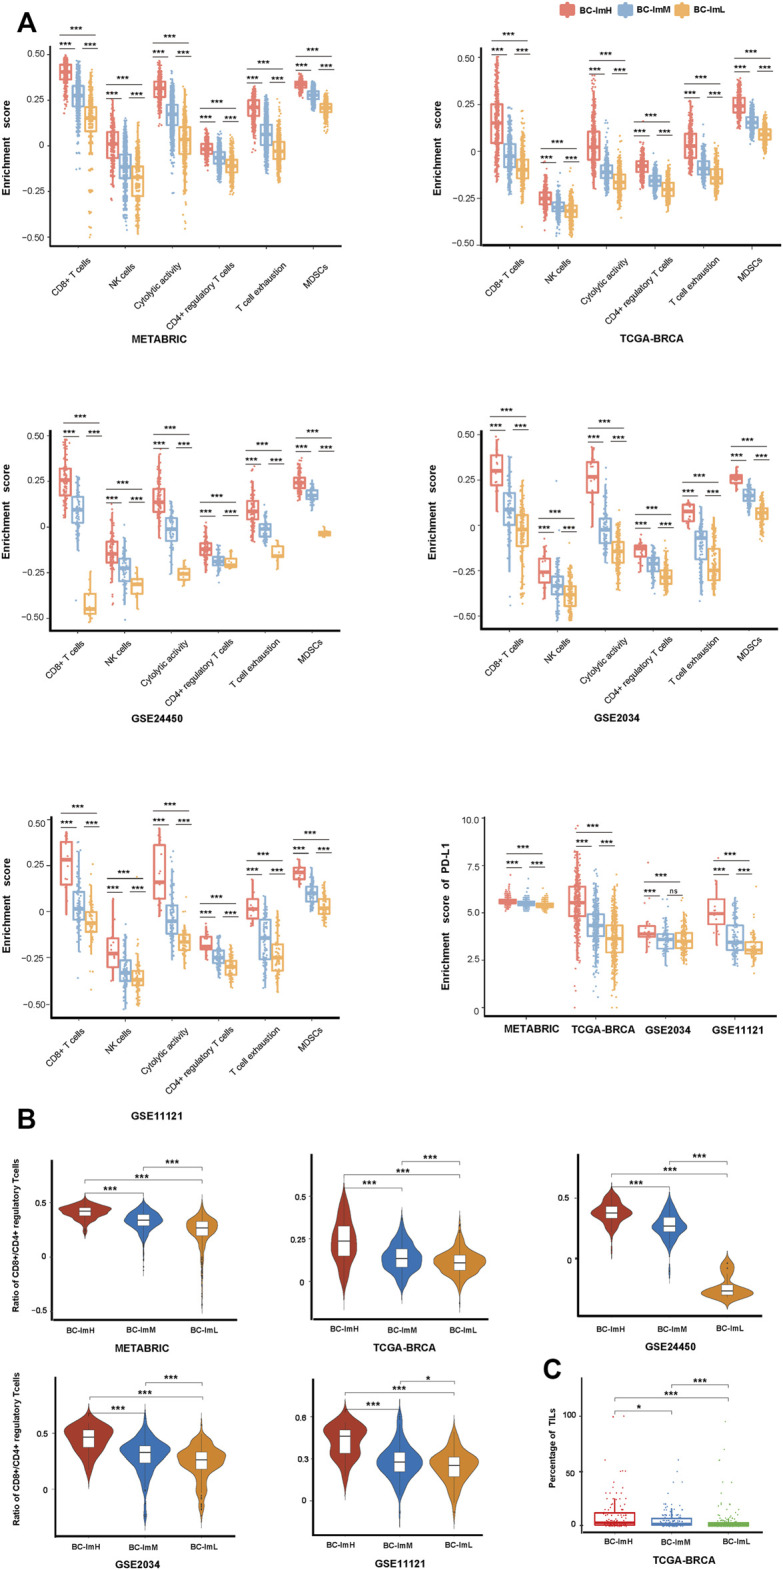
FIGURE 2.

Comparisons of the enrichment scores of immune signatures among the three BC subtypes. Comparisons of the enrichment scores of immunostimulatory signatures (NK cells, CD8+ T cells, and immune cytolytic activity) and immunosuppressive signatures (CD4+ regulatory T cells, myeloid-derived suppressor cells (MDSCs), T cell exhaustion, and PD-L1) (A), ratios of immunostimulatory over immunosuppressive signatures (CD8+/CD4+ regulatory T cells) (B), and the percentage of tumor infiltrating lymphocytes (TILs) (C) among the three BC subtypes. The one-tailed Mann–Whitney U test or two-tailed Student’s t test p values are shown. *p < 0.05, **p < 0.01, ***p < 0.001, ns p ≥ 0.05. It also applies to the following figures.
