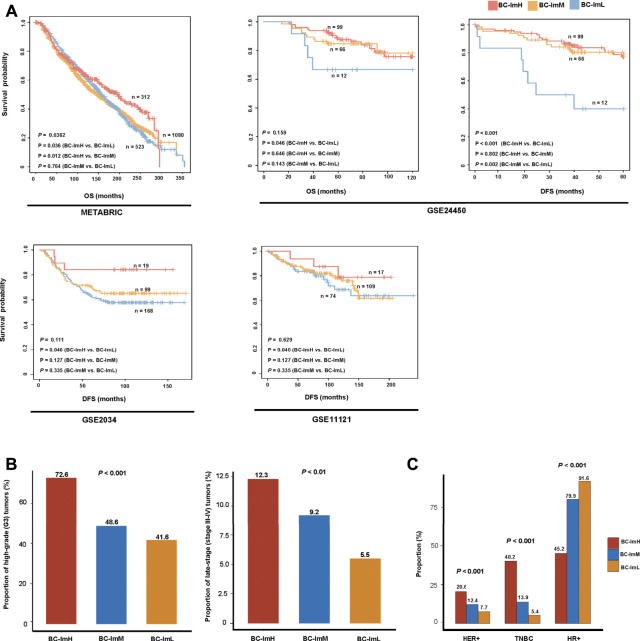
FIGURE 3.
Comparisons of clinical features among the BC subtypes. (A) Comparisons of overall survival (OS) and disease-free survival (DFS) time among the BC subtypes by Kaplan–Meier curves. The log-rank test p values are shown. Comparisons of the proportion of high-grade (G3) tumors, the proportion of late-stage (stage III–IV) tumors (B), and proportions of HER2+, TNBC, HR+ tumors (C) among the BC subtypes in METABRIC. The Fisher’s exact test p values are shown.

