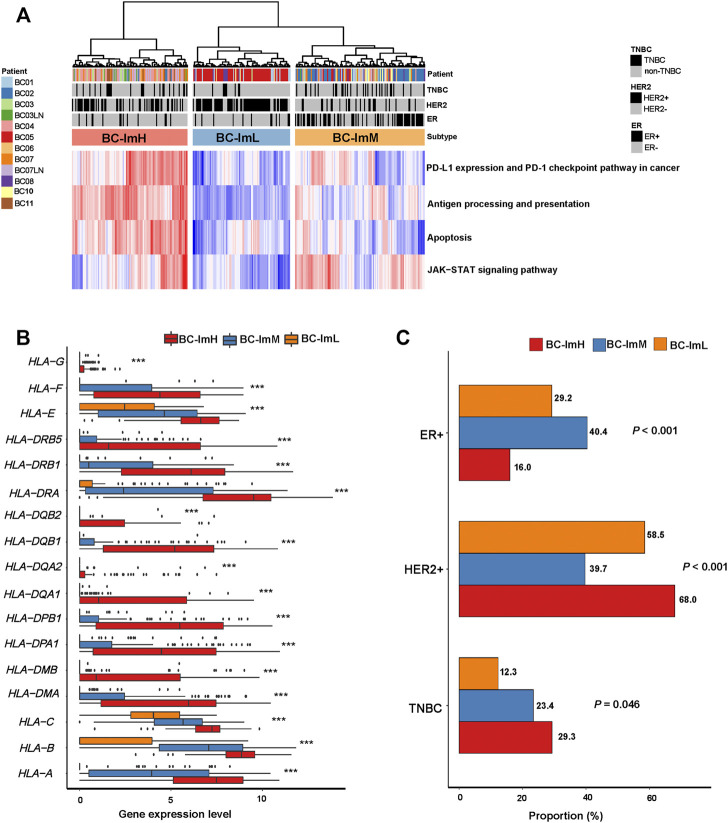
FIGURE 8.
Validation of the BC subtyping method in a single-cell RNA-seq dataset. (A) Hierarchical clustering of 317 tumor cells from ten BC patients based on the enrichment scores of four immune-related pathways. (B) Comparisons of the expression levels of 19 human leukocyte antigen (HLA) genes among the subtypes. One-way analysis of variance (ANOVA) test p values are shown. (C) Comparisons of proportions of TNBC, HER2+, and ER + tumor cells among the subtypes. The Fisher’s exact test p values are shown.

