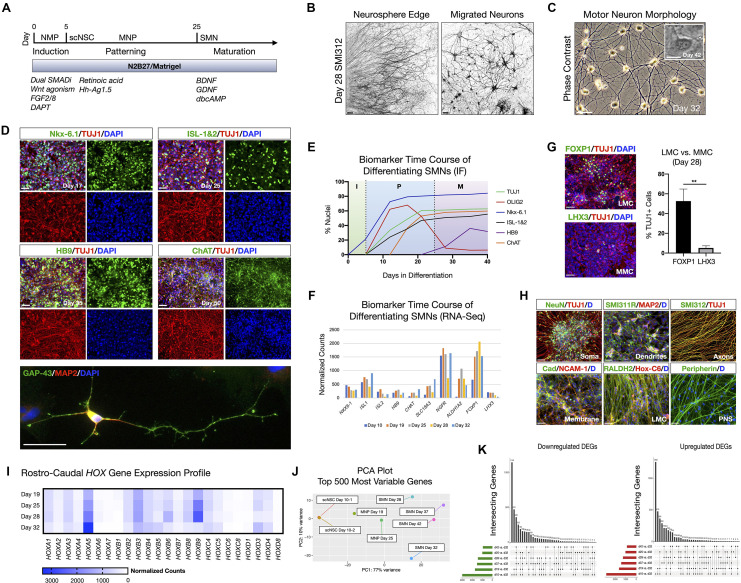
Figure 1.
hiPSC-derived scNSCs generate SMNs regionally-matched for the spinal cord. (A) Overview of differentiation protocol used to generate cervically-patterned SMNs through NMP, scNSC, and MNP stages. Small molecules and growth factors used in caudo-ventral patterning and maturation are listed. (B) Pan-axonal antibody SMI312 labeling of day 28 adherent neurosphere (NS) culture at NS edge (left) and more distal field of migrated neurons (right). SMI312 signal shown with inverted LUT. (C) Phase contrast images of day 32 SMN cultures. Inset is day 42 single SMN with characteristic trapezoidal shape and prominent nucleolus. (D) SMN hallmark biomarkers. Top: Motor progenitor spinal domain transcription factor Nkx-6.1 (day 17); SMN-related factors ISL-1&2 (day 25); Middle: SMN-specific HB9 (day 35); choline acetyltransferase enzyme ChAT (day 50); Cells are counterstained with TUJ1 and DAPI. Bottom: IF of single neuron. GAP-43/MAP2/DAPI (day 32). (E) Time course of biomarker expression in differentiating SMN cultures (I, induction; P, patterning; M, maturation). Percent of nuclei were counted from IF images. N = 3 fields were averaged per biomarker per time point (>100 cells per field). (F) Time course biomarker expression of differentiating SMN cultures by bulk RNA-Seq. (G) IF images and histogram of later motor column (LMC) SMN transcription factor FOXP1 (53 ± 12%; n = 349 cells) vs. medial motor column (MMC) SMN transcription factor LHX3 (5 ± 2%; n = 304 cells; two-tailed t test, t = 6.629, df = 4, **P = 0.0027). (H) Visualizing neuronal compartments and SMN regional specificity by biomarker. (I), RNA-Seq validation of cervical spinal cord identity by normalized Hox gene expression profile in differentiating SMN cultures. (J) PCA plot of 500 most variable genes during scNSC neuronal differentiation. (K) UpSet plots of intersecting downregulated (left) and upregulated (right) differentially expressed genes (DEGs) using individual time point comparisons in differentiation. Plot height represents the number of overlapping DEGs between the sets below marked with filled circles. Vertical lines connecting two or more dots denote the set of genes overlaps the connected sets. Data are reported as mean ± s.e.m. Scale bars are 50 μm, and 10 μm in (C) inset.

