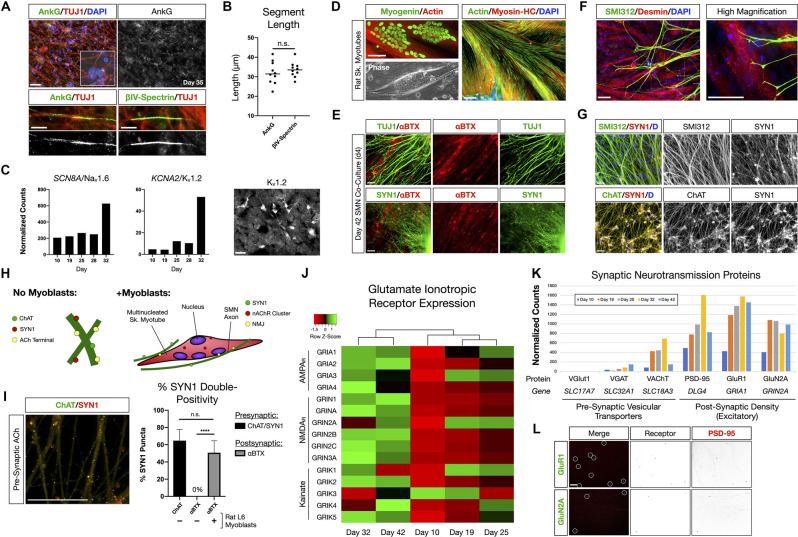
Figure 2.
NMP-derived SMNs are positive for axon initial segment proteins, assemble neuromuscular junctions, and develop characteristic synaptic profiles. (A) Maturing SMN-NS cultures exhibit short segments immunopositive for AIS proteins Ankyrin-G (AnkG) and βIV-Spectrin at day 35. Top: AnkG/TUJ1 counterstained with DAPI (nuclei). High-magnification image depicts AnkG+ staining distal to the soma. Bottom-left: AnkG immunopositive region along TUJ1+ filaments. Bottom-right: βIV-Spectrin immunopositive region along TUJ1+ filaments. (B) Length of AnkG (32 ± 2 μm) and βIV-Spectrin (34 ± 1 μm) segments by day 35 (two-tailed t test, t = 0.7082, df = 18, P = 0.4879, n = 10 segments measured per antibody). (C) Time course normalized expression of AIS-related voltage gated ion channels Nav1.6 and Kv1.2 by RNA-Seq. IF showing cells positive for Kv1.2 on right. (D) Rat L6 multinucleated skeletal myotubes for NMJ formation assays. (E) Day 4 co-culture of SMN-NS (day 42) seeded onto rat myotubes. Top: TUJ1+ filament termination onto αBTX+ junctions (nAChR). Bottom: SYN1/αBTX. (F) SMI312 axon termination in Desmin+ myotubes resembling early motor end plates. (G) Co-localization of cholinergic terminals (ChAT, bottom) with SYN1 puncta along axons (SMI312, top). (H) Cartoon diagram of ChAT/SYN1 pre-synaptic ACh terminals and nAChR post-synaptic machinery. (I) IF image and histogram of ChAT/SYN1 (64.7 ± 13.1%, n = 118 puncta) and SYN1/αBTX co-localization in the absence (0%, n = 48 puncta) or presence (50.7 ± 13.8%, n = 69 puncta) of L6 myotubes (two-tailed t test, t = 10.36, df = 14, ****P < 0.0001). N = 8 fields were averaged for each condition. (J) Heatmap of glutamate ionotropic receptor expression (AMPAR, NMDAR, Kainate) during SMN differentiation. (K) Histogram of normalized gene expression for pre-synaptic vesicular transporters (VGlut1 excitatory, VGAT inhibitory, VAChT cholinergic) and post-synaptic density proteins/excitatory receptors. (L) Co-localization of AMPAR GluR1 (top) and NMDAR GluN2A (bottom) with scaffolding protein PSD-95. Individual channels provided as inverted LUT. Data are reported as mean ± s.e.m. Scale bars are 50 μm, and 10 μm in (A) high magnification images (bottom). n.s., not significant.

