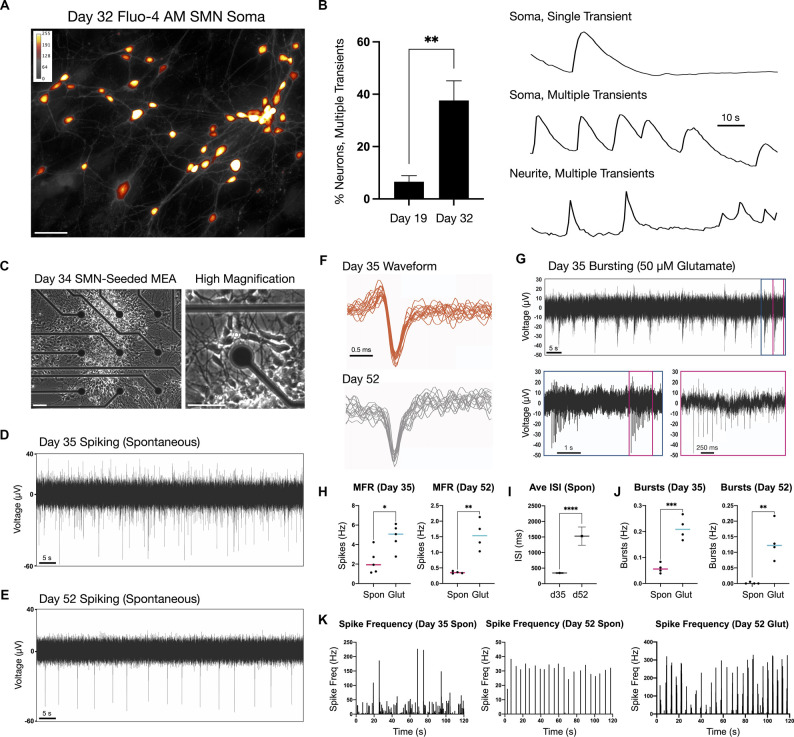
Figure 3.
Firing properties of adherent spinal neurons by calcium imaging and microelectrode arrays (MEA) at two time points. (A) Calcium dye Fluo-4 AM somatic signal in adherent SMNs (day 32). ImageJ Smart LUT fluorescence intensity (yellow high, gray low). (B) Left: Proportion of SMNs exhibiting multiple calcium transients above threshold in the 1.5 min recording window at day 19 (6.6 ± 2.3%, n = 83 neurons, N = 5 repeat experiments) and day 32 (37.6 ± 7.5%; n = 101 neurons, N = 5 repeat experiments). **P = 0.0043. Right: Representative examples of single and multiple transients in soma and neurite of day 32 SMNs over the 1.5 min recording window (F/Fo). Scale bar is 10 s. (C) Phase contrast images of SMN-seeded MEAs at day 34 in differentiation (seeded day 28). (D,E) Representative traces from single MEA channel depicting spontaneous SMN voltage spikes recorded at day 35 (D) and day 52 (E) in differentiation. (F) Representative overlay of spontaneous spike waveforms at day 35 and day 52 from traces in (D,E). (G) Representative single electrode bursting in day 35 cultures stimulated with 50 μM glutamate. Three time scales are shown. Pink box depicts spikes within a single burst. (H) Quantification of mean firing rate (MFR, Hz) in day 35 and day 52 cultures. Spontaneous firing is compared to 50 μM glutamate stimulation (two-tailed t test; day 32 t = 3.096, df = 8, *P = 0.0148; day 52 t = 4.968, df = 6, **P = 0.0025). (I) Average inter-spike interval (ISI) in day 35 vs. day 52 SMNs under spontaneous conditions (t = 10.52, df = 499, ****P < 0.0001). (J) Single electrode burst rate (Hz) in day 35 vs. day 52 SMNs (day 32 t = 6.426, df = 6, ***P = 0.0007; day 52 t = 4.356, df = 6, **P = 0.0048). (K) Spike frequency (Hz) vs. time (s) in day 35 vs. day 52 SMNs. Also shown is spike frequency for day 52 SMNs stimulated with 50 μM glutamate is shown (rightmost plot). Spontaneous (spon), glutamate (glut). Scale bars are 50 μm.

