Figure 5.
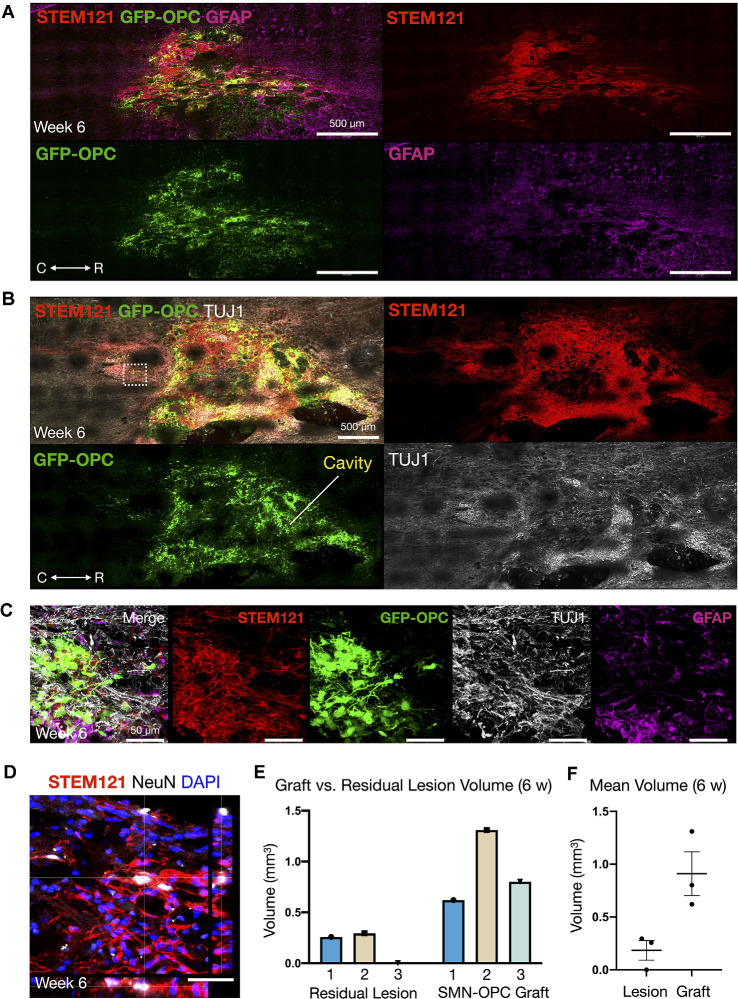
Continued survival of SMN-OPC cell suspensions at 6 weeks post-transplantation. (A) Low power image of the graft at 6 weeks shown with STEM121/GFP-OPC/GFAP to depict host glial cells. (B) Low power image of the graft at 6 weeks shown with STEM121/GFP-OPC and TUJ1 to validate retention of the neuronal phenotype. White box denotes high magnification field shown in (C), imaged caudal to the lesion epicenter. (C) High magnification merged image and individual channels (STEM121/GFP-OPC/TUJ1/GFAP) at 6 weeks post-transplantation. (D) STEM121 immunostain with mature neuronal marker NeuN co-localization. (E,F) Cavalieri volumetric analysis of the residual lesion and grafts. Color matching corresponds to the same animal. Shown are residual lesion vs. graft volume for individual spinal cords at 6 weeks (mm3) (E) and mean ± s.e.m (F). N = 3 animals were sacrificed at 6 weeks post-transplantation. R (rostral), C (caudal). Individual scale bars are provided.

