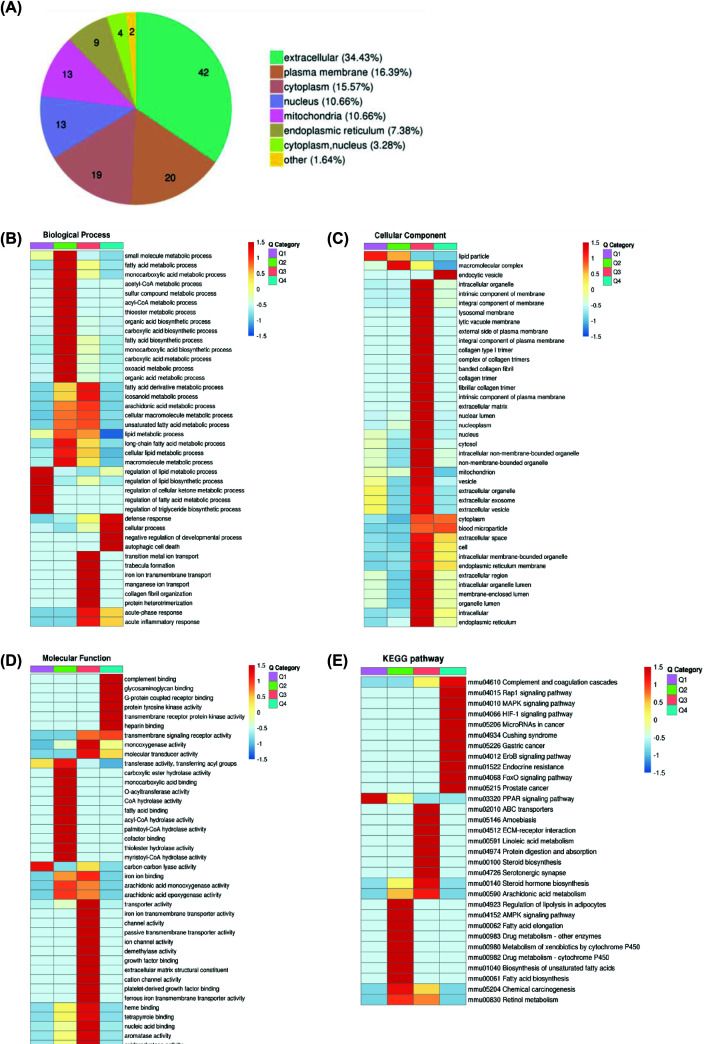
Figure 4. Functional enrichment analysis of DEPs in the liver after acupuncture treatment.
(A) Subcellular localization of DEPs. (B–D) The horizontal direction represents the enrichment test results of the different parts, and the vertical direction is the description of the differential expression enrichment related functions. Red indicates stronger degree of enrichment (the deeper the red color, the stronger the enrichment), and the blue color indicates a weaker enrichment (the lighter the blue, the weaker the enrichment). (E) Cluster analysis heatmap based on KEGG enrichment.

