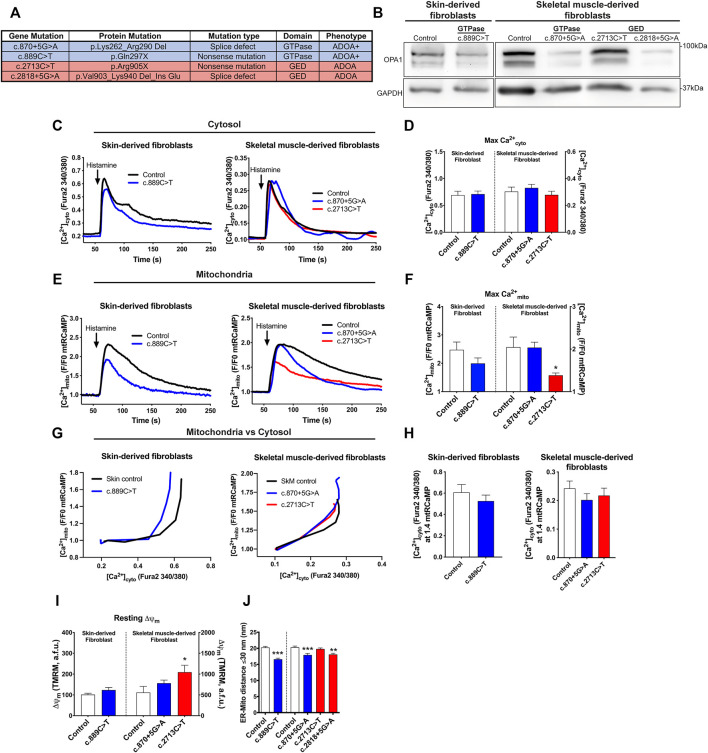
FIGURE 2.
Mitochondrial Ca2+ homeostasis, mitochondrial membrane potential, and ER-mitochondria distance are altered in cells from ADOA patients carrying OPA1 domain-specific mutations. (A) OPA1 disease-related mutations, protein product prediction, type of mutation, and clinical ADOA phenotype, evaluated in this study. (B) Western blot analysis of OPA1 protein abundance of the skin or skeletal muscle-derived fibroblasts from ADOA patient’s cells. (C) Skin or skeletal muscle ADOA-derived fibroblast expressing mtRCaMP were loaded with Fura2-AM (2 μM) for 20 min at room temperature. To induce the release of Ca2+ through IP3R activation, Histamine 100 μM was used. The graph show [Ca2+]cyto expressed as Fura2-AM 340/380 mean ratio values (Skin Control, n = 3/12; preparations/cells; Skin OPA1c.889C>T, n = 3/18; SkM Control, n = 5/17, SkM OPA1c.870+5G>A, n = 7/21; SkM OPA1c.2713C>T, n = 4/19). (D) The bar chart shows maximal [Ca2+]cyto amplitude upon agonist stimulation. (E) Mean traces of Skin or skeletal muscle ADOA-derived fibroblast [Ca2+]mito upon Histamine stimulation. (F) The bar chart shows maximal [Ca2+]mito uptake upon agonist stimulation expressed in F/F0 to mtRCaMP. (G) The graph shows mean traces of [Ca2+]mito uptake vs IP3R-induced [Ca2+]cyto release. (H) [Ca2+]cyto at which WT, Opa1 −/− , and +OPA1 WT shows 1.4 fold increase in [Ca2+]mito upon agonist stimulation. (I) Skin or skeletal muscle fibroblasts from ADOA-patients were loaded with TMRM 10 nM and Fura2-AM. Incubation and stimulation were performed as described above. At the end of the experiment, FCCP 10 µM was added to dissipate me membrane potential. The bar chart shows resting Δψm. (Skin Control, n = 3/25; preparations/cells; Skin OPA1c.889C>T, n = 3/18; SkM Control, n = 3/25, SkM OPA1c.870+5G>A, n = 3/25; SkM OPA1c.2713C>T, n = 3/28) (J) ER-mitochondria distance analysis for all mitochondria with ER contact (≤30 nm distance) (Skin control, n = 2/96; preparations/mitochondria), (OPA1c.889C>T, n = 2/101), (SkM control, n = 3/106), (OPA1c.870+5G>A, n = 3/120), (OPA1c.2713C>T, n = 3/123), (OPA1c.2818+5G>A, n = 2/92). p-values for Skin fibroblasts were calculated by Mann-Whitney U-test. p-values for SkM fibroblasts were calculated using Kruskal-Wallis test. Data are mean ± SEM. Error bar represent SEM. *p < 0.05, **p < 0.01, ***p < 0.001 vs respective control condition The blue color is indicative of GTPase mutants and the red color for GED mutants.

