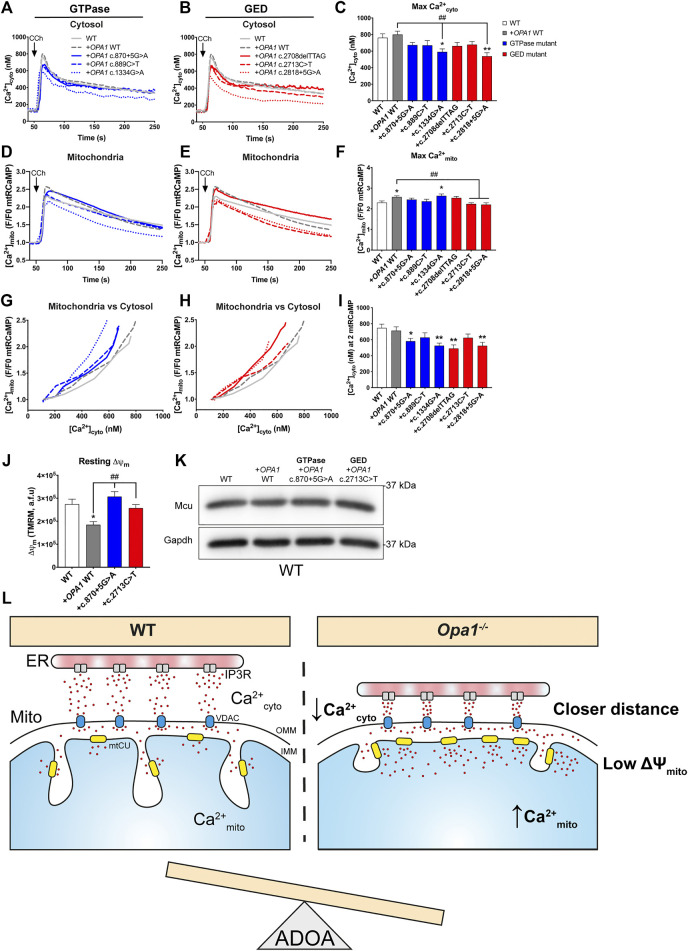
FIGURE 4.
Overexpression of ADOA-causing OPA1 mutants impairs ER-to mitochondrial Ca2+ transfer. (A,B) WT MEF cells expressing OPA1 mutants, mtRCaMP, and the muscarinic receptor 3 (M3R), were incubated with Fura2-AM and stimulated with 200 µM of Carbachol (CCh) to induce the release of Ca2+ from the ER to the cytosol via activation of IP3R. Graph show mean traces of [Ca2+]cyto expressed in nM, in WT MEF expressing GTPase and (B) in GED mutants (WT MEF, n = 3/64; WT + OPA1 WT, n = 3/58; WT + OPA1c.870+5G>A, n = 3/49; WT + OPA1c.889C>T, n = 3/48; WT + OPA1c.1334G>A, n = 3/51; WT + OPA1c.2708delTTAG, n = 3/47; WT + OPA1c.2713C>T, n = 3/49; WT + OPA1c.2818+5G>A, n = 3/42) (C) Bar chart shows maximal [Ca2+]cyto amplitude upon agonist stimulation. (D,E) The graph shows mean traces of [Ca2+]mito uptake in OPA1 GTPase and GED mutants, expressing WT MEF cells. (F) Maximal [Ca2+]mito uptake induced upon agonist stimulation. (G,H) OPA1 GTPase and GED mutants [Ca2+]mito uptake vs IP3R-induced [Ca2+]cyto upon agonist stimulation. (I) [Ca2+]cyto at which OPA1 GTPase and GED mutants shows 2 fold increase in [Ca2+]mito. (J) The same cells described in A were incubated with TMRM 20 nM and stimulated as described by Carbachol. The bar graph shows resting Δψm calculated as the subtraction between initial fluorescence and fluorescence after FCCP addition (WT MEF, n = 3/63; WT + OPA1 WT, n = 3/117; WT + OPA1c.870+5G>A, n = 3/159; WT + OPA1c.2713C>T, n = 3/117; WT). (K) Western blot analysis of Mcu protein abundance upon acute expression of OPA1 GTPase or GED mutants in WT MEF cells. Data are mean ± SEM. Error bar represent SEM. *p < 0.05, **p < 0.01 vs. WT condition. # p < 0.05, ## p < 0.01 vs. WT + OPA1 WT condition. The blue color is indicative of GTPase mutants and the red color for GED mutants. (L) Working model. Cells lacking OPA1 exhibited closer ER-mitochondria contacts and a leftward shift in Ca2+ cyto dependence compared to WT cells evoking a more efficient ER-to-mitochondrial Ca2+ transfer. OPA1 ADOA-causing mutants disrupt Ca2+ homeostasis inducing an OPA1 dominant-negative phenotype, probably contributing to disease progression.

