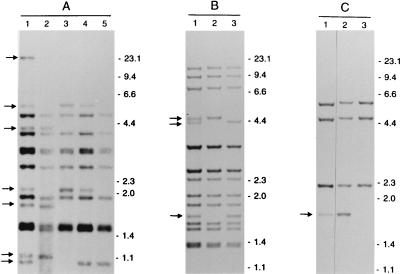
FIG. 1.
IS6110 RFLP patterns of isolates, showing LIBs, and SCCs, from three different patients (A to C). Lanes 1 show the banding patterns of the isolates, with LIBs indicated by arrows. Lanes 2 to 5 show the banding patterns of SCCs of these isolates. The numbers on the right indicate the sizes of standard DNA fragments in kilobase pairs.

