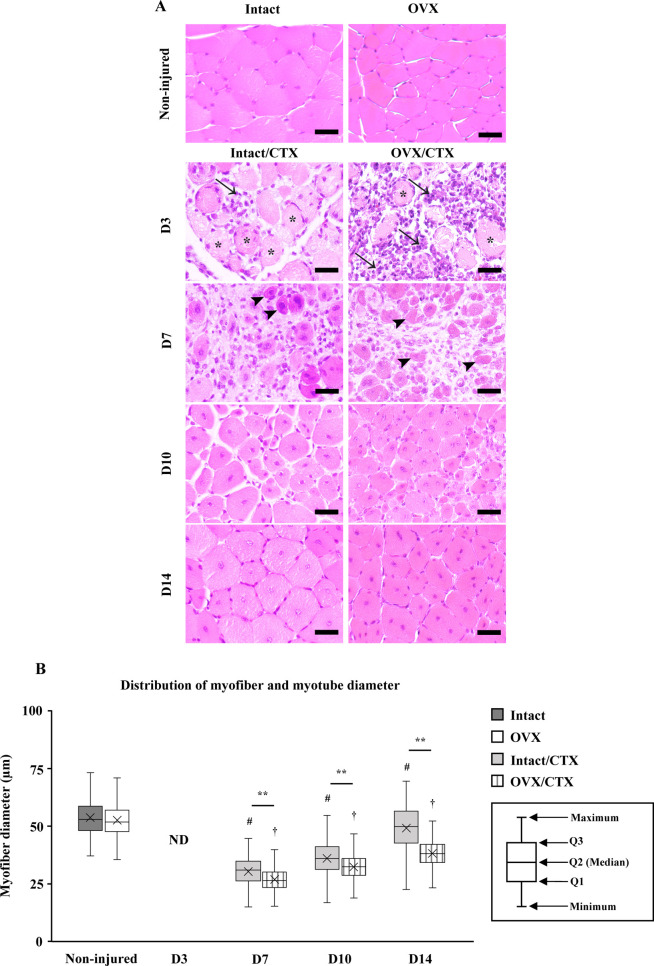
Fig. 2.
(A) Morphological changes of tibialis anterior (TA) muscles in the Intact/Cardiotoxin (CTX) group compared with those in the ovariectomized (OVX)/CTX group at days 3, 7, 10 and 14 (D3, D7, D10 and D14) after CTX injection. Arrows indicate cell infiltration. Asterisks indicate myofiber degeneration. Arrowheads indicate newly formed myotubes, scale bar: 50 µm. (B) Comparison of the diameters of regenerated myotubes at different time points after CTX injection between the Intact/CTX group and OVX/CTX group. The boxes represent the distribution of diameters between first quartile (Q1) and third quartile (Q3). The horizontal line between Q1 and Q3 represents the median (Q2) of regenerated myotubes in each group. Outliers are not shown in the graph. ×indicates average diameter of regenerated myotubes in each group, ** indicates significant difference between groups, # indicates significant difference from intact groups (non-injured), † indicates significant difference from OVX groups (non-injured), P<0.01. ND, not detected.

