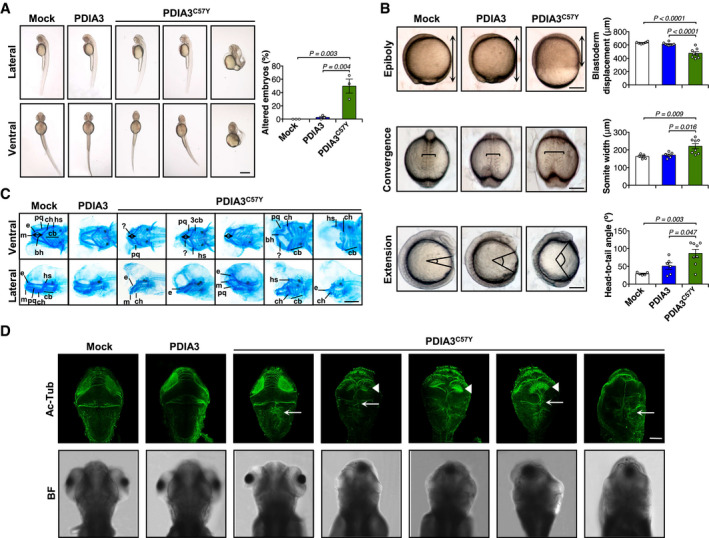
Figure 2. Expression of PDIA3C57Y affects vertebrate development.

-
A–DZebrafish embryos were injected at the one‐cell stage with sense mRNA coding for either wild‐type PDIA3‐V5 or PDIA3C57Y‐V5. (A) Lateral and ventral micrographs of embryos at 48 h post‐fertilization (hpf) showing typical morphological alterations caused by PDIA3C57Y expression such as shortening of anterior–posterior axis, cyclopia, and tail curvature. Scale bar 500 μm. Mock, n = 125; PDIA3, n = 140; PDIA3C57Y, n = 239 embryos injected in three independent experiments. Graph shows quantification of percentage of embryos with altered morphology in each independent experiment. Data are shown as mean ± s.e.m. and statistical analysis performed using one‐way ANOVA with Tukey's post hoc test. (B) Cell movements during gastrulation. Upper panel: lateral micrographs of embryos undergoing epiboly at 9 hpf. Graph shows quantification of blastoderm displacement. Mock, n = 6; PDIA3, n = 8; PDIA3C57Y, n = 8. Middle panel: dorsal micrograph of embryos at 12.5 hpf showing convergence. Graph shows quantification of somite width. Mock, n = 5; PDIA3, n = 6; PDIA3C57Y, n = 8. Lower panel: lateral micrograph of embryos at 13 hpf showing extension. Graph shows quantification of head to tail angle. Mock, n = 5; PDIA3, n = 6; PDIA3C57Y, n = 8. Scale bar 200 μm. Data are shown as mean ± s.e.m. and statistical analysis performed using one‐way ANOVA with Tukey's post hoc test. (C) Alcian blue staining of cartilage showing craniofacial features of embryos at 6 days post‐fertilization (dpf). Embryos expressing PDIA3C57Y show reduced distance between Meckel's (m) and ceratohyal (ch) cartilages (double‐headed arrow), kinked palatoquadrate (pq), and additional unidentified pieces of cartilages (?). e, ethmoid plate; bh, basihyal; hs, hyosymplectic; cb, ceratobranchials. Scale bar 200 μm. Mock, n = 6; PDIA3, n = 5; PDIA3C57Y, n = 15. (D) Representative micrographs of acetylated‐tubulin (Ac‐Tub) indirect immunofluorescence in dorsal views of embryos at 96 hpf. White arrowheads and arrows in embryos expressing PDIA3C57Y point to the abnormal organization of axonal tracts in the optic tectum and the fused axons at the dorsal midline of the hindbrain, respectively. BF, bright field. Scale bar 100 μm. Mock, n = 3; PDIA3, n = 3; PDIA3C57Y, n = 11.
Source data are available online for this figure.
