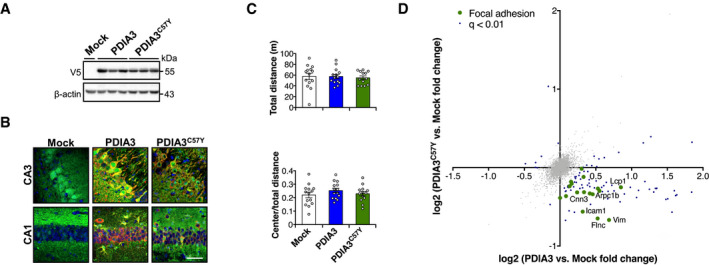
Figure EV2. Analysis of PDIA3C57Y expression in the central nervous system of mice.

-
A–DYoung mice at P55 received bilateral stereotaxis injection of adeno‐associated virus serotype 9 (AAV9) to express wild‐type PDIA3‐V5 or PDIA3C57Y‐V5 and GFP or GFP alone (Mock) into the hippocampus for behavioral and proteomic analysis. (A) PDIA3 protein levels in hippocampus at P180 detected by Western blot analysis. β‐actin employed as loading control. (B) Representative micrographs of hippocampus analyzed by immunofluorescence to GFP (green) and V5 (red) at P180 showing neuronal transduction in CA3 and CA1 regions. Nucleus stained with Hoechst (blue). Scale bar 50 μm. (C) Open field. Mice were placed in a squared arena and recorded for 15 min. Total distance (upper graph) and center to total distance ratio (lower graph) were measured as locomotor activity and exploratory behavior, respectively. Mock, n = 14; PDIA3, n = 14; PDIA3C57Y, n = 13. Data are shown as mean ± s.e.m. and statistical analysis performed using one‐way ANOVA with Tukey's post hoc test. No statistically significant differences exist between groups. (D) Proteomic analysis at P180. Mock, n = 3; PDIA3, n = 3; PDIA3C57Y, n = 4. Scatter plot of proteomic analysis of hippocampus tissue of mice expressing wild‐type PDIA3 or PDIA3C57Y. The x‐axis denotes logarithmic fold change in total protein levels in wild‐type PDIA3 mice relative to Mock littermates. The y‐axis denotes logarithmic fold change in total protein levels in PDIA3C57Y mice relative to Mock littermates. Representative hits of focal adhesion are highlighted in green.
Source data are available online for this figure.
