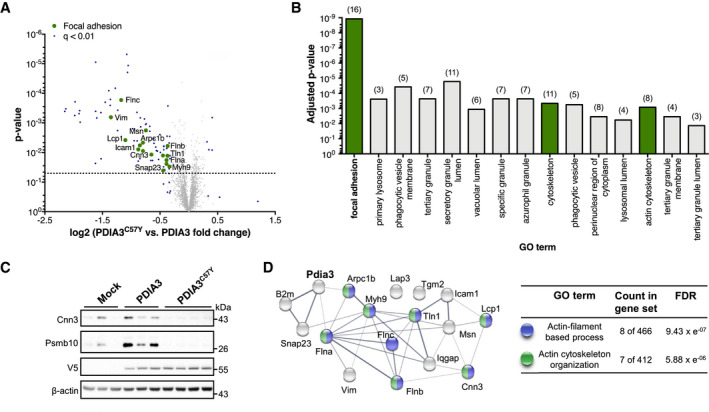
Figure 4. Down‐regulation of cell adhesion molecules in brain tissue expressing PDIA3C57Y .

-
A–DYoung mice at P55 received bilateral stereotaxic injection of adeno‐associated virus serotype 9 (AAV9) to express wild‐type PDIA3‐V5 or PDIA3C57Y‐V5 and GFP or GFP alone (Mock) into the hippocampus for proteomic analysis. (A) Volcano plot of proteomic analysis of hippocampus tissue of mice expressing wild‐type PDIA3 or PDIA3C57Y. The x‐axis denotes logarithmic fold change of total protein levels in PDIA3C57Y relative to wild‐type PDIA3 mice. The y‐axis denotes the P‐value of statistical analysis. Dotted line indicates threshold for statistical significance. Statistical analysis performed using two‐tailed Student's t‐test with 95% confidence interval. PDIA3, n = 3; PDIA3C57Y, n = 4. (B) Functional categorization of proteomic hits according to the Gene Ontology (GO) annotation. Graph shows significantly enriched GO terms of cellular component comparing wild‐type PDIA3 to PDIA3C57Y mice. The number of genes associated with each term is indicated in parenthesis. Focal adhesion hits are highlighted in green in the volcano plot presented in A. (C) Western blot validation of the total protein levels of the proteomic hits Calponin‐3 (Cnn3) and Proteasome subunit beta type‐10 (Psmb10; see Dataset EV4). V5 and β‐actin were employed as loading control. (D) Network analysis of Pdia3 interaction with identified genes related to focal adhesion as presented in A and B (see Dataset EV5). The nodes represent the proteins and the edges interactions. The thickness of the edges indicates the extent of interactions, which not necessarily mean physical binding. The table shows GO annotation of biological function of network components. FDR, false discovery rate.
Source data are available online for this figure.
