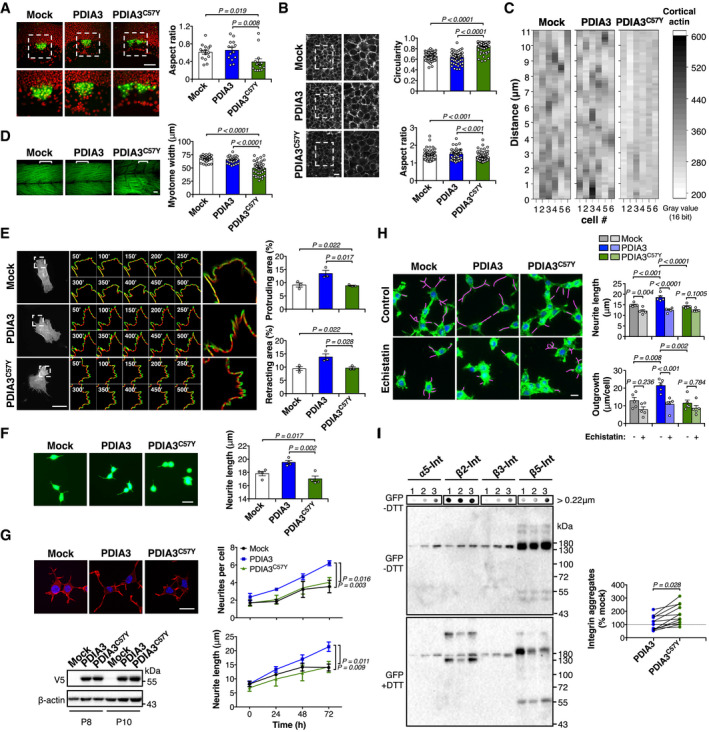
Figure 5. PDIA3C57Y disturbs cell adhesion and actin cytoskeleton.

-
ATransgenic zebrafish embryos expressing GFP in dorsal forerunner cells (DFC), Tg(sox17:GFP), were injected at the one‐cell stage with sense mRNA coding for either wild‐type PDIA3‐V5 or PDIA3C57Y‐V5. Fluorescence micrographs of DFC from dorsal views obtained at 8 hpf. Nuclei depicted in red. Right images are digital magnifications of areas delimited by white dashed squares. Scale bar 100 μm. Graph shows quantification of aspect ratio of the DFC cluster. Mock, n = 15; PDIA3, n = 14; PDIA3C57Y, n = 14. Data are shown as mean ± s.e.m. and statistical analysis performed using Kruskal–Wallis with Dunn's post hoc test.
-
B, CTransgenic zebrafish embryos ubiquitously expressing the mCherry‐tagged actin binding domain of utrophin, Tg(actb1:mCherry‐utrCH), were injected at the one‐cell stage with sense mRNA coding for either wild‐type PDIA3‐V5 or PDIA3C57Y‐V5. (B) Fluorescence micrographs of deep cells from the animal pole obtained at 8 hpf. Right images are digital magnifications of areas delimited by white dashed squares. Scale bar 20 μm. Graphs show quantification of cell circularity and aspect ratio. Mock, n = 55; PDIA3, n = 57; PDIA3C57Y, n = 84 cells quantified from at least three embryos per group. Data are shown as mean ± s.e.m. and statistical analysis performed using Mann–Whitney test. (C) Heatmap of fluorescence intensity of mCherry along the cortex of individual deep cells.
-
DPhalloidin staining of skeletal muscle of embryos at 48 hpf. Embryos expressing PDIA3C57Y show decreased myotome width and disorganized muscle fibers. Scale bar 20 μm. Graph shows quantification of myotome width. Mock, n = 40; PDIA3, n = 28; PDIA3C57Y, n = 40 myotomes quantified from at least five embryos. Data are shown as mean ± s.e.m. and statistical analysis performed using one‐way ANOVA with Tukey's post hoc test.
-
EMouse embryonic fibroblast knock‐out for Pdia3 (MEF Pdia3 KO) was co‐transfected with constructs for expression of wild‐type PDIA3‐V5 or PDIA3C57Y‐V5, or empty vector (Mock), and EGFP‐LifeAct. Representative micrographs of live cell imaging performed at 48 h after transfection are shown. Segmentation of time‐lapse images was used to obtain protruding (green) and retracting (red) areas. Zoom of representative cell areas is shown. Protruding and retracting area was quantified using Fiji software. Scale bar 50 μm. n = 3 independent experiments. A total of 10 movies per group with 1 or 2 cells per movie were quantified. Data are shown as mean ± s.e.m. and statistical analysis performed using one‐way ANOVA with Tukey's post hoc test.
-
FNSC‐34 cells cotransfected with constructs for transient expression of wild‐type PDIA3‐V5 or PDIA3C57Y‐V5, or empty vector (Mock), and GFP were differentiated and neurite length measured at 48 h. Scale bar 20 μm. n = 4 independent experiments. Total cells quantified: Mock, 200; PDIA3, 157; PDIA3C57Y, 145. Data are shown as mean ± s.e.m. and statistical analysis performed using one‐way ANOVA with Tukey's post hoc test.
-
GNSC‐34 neuronal cell lines stably expressing wild‐type PDIA3‐V5 or PDIA3C57Y‐V5, or empty vector (Mock) were differentiated for 72 h and neurite number and length determined over time by high‐content analysis of cells stained with phalloidin. Scale bar 20 μm. n = 3 independent experiments. Total cells quantified: Mock, 343; PDIA3, 388; PDIA3C57Y, 495. Data are shown as mean ± s.e.m. and statistical analysis performed using two‐way ANOVA with Tukey's post hoc test. Western blot analysis of PDIA3 levels in NSC‐34 cell lines employed for the differentiation assay at different passages (P) after initial transfection. β‐actin employed as loading control.
-
HNSC‐34 neuronal cell lines stably expressing wild‐type PDIA3‐V5 or PDIA3C57Y‐V5, or empty vector (Mock) were differentiated for 24 h and treated with 40 nM Echistatin to inhibit integrin signaling. The cells were collected at 72 h of differentiation, stained with phalloidin‐FITC, and scanned by automated microscopy for analysis of neurite length and outgrowth. Magenta traces mark neurite extension. Scale bar 30 μm. n = 5 independent experiments with at least 96 neurites quantified per group in each experiment. Data are shown as mean ± s.e.m. and statistical analysis performed using one‐way ANOVA with Sidak's post hoc test.
-
IWestern blot and filter‐trap analysis of a panel of integrin paralogs in stable NSC‐34 cell lines overexpressing PDIA3 or PDIA3C57Y, or mock control. The cells were transfected with constructs for overexpression of α5‐integrin (α5‐int) fused to GFP, β2‐integrin (β2‐int) fused to YFP, β3‐integrin (β3‐int) fused to YFP, and β5‐integrin (β5‐int) fused to 2xGFP and analyzed under non‐reducing (−DTT, dithiothreitol) or reducing conditions (+DTT). The anti‐GFP antibody detects both GFP and YFP tags. 1, Mock, 2, PDIA3‐V5, and 3, PDIA3C57Y‐V5. Representative image of three independent experiments. The graph shows quantification of integrin aggregates relative to mock control detected under non‐reducing conditions. Lines connect aggregates quantified in the same experiment. Aggregates from different integrin paralogs were pooled in the statistical analysis using two‐tailed Student's t‐test. Figure EV3C shows quantification of aggregates from each integrin paralog separately.
Source data are available online for this figure.
