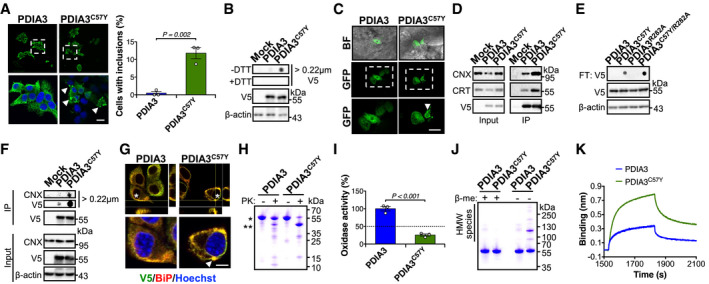
Figure 6. Abnormal biochemical properties of PDIA3C57Y .

-
A, BNSC‐34 cells were transfected with constructs for expression of wild‐type PDIA3‐V5 or PDIA3C57Y‐V5, or empty vector (Mock). (A) Fluorescence micrographs of V5 immunostaining at 48 h after transfection. Bottom images are digital magnifications of areas delimited by white dashed squares. Arrowheads point to PDIA3C57Y‐V5 puncta. Scale bar 15 μm. Graph shows quantification of percentage of cells containing PDIA3 puncta. n = 3 independent experiments. Total cells quantified: PDIA3, 365; PDIA3C57Y, 301. Data are shown as mean ± s.e.m. and statistical analysis performed using two‐tailed Student's t‐test. (B) Filter‐trap analysis of PDIA3‐V5 aggregates under non‐reducing (−DTT, dithiothreitol) and reducing (+DTT) conditions at 48 h after transfection. V5 and β‐actin Western blot analysis was employed for loading control. Representative image of five independent experiments.
-
CZebrafish embryos were injected at the four‐cell stage with plasmid DNA for expression of wild‐type PDIA3‐GFP or PDIA3C57Y‐GFP. Representative fluorescence micrographs of embryos at 48 hpf show mosaic expression of PDIA3‐GFP and PDIA3C57Y‐GFP in epithelial cells. Bottom images are digital magnifications of areas delimited by white dashed squares. Arrowhead points to PDIA3C57Y‐GFP puncta. BF, bright field. Scale bar 50 μm. n = 3 embryos in each group.
-
DHEK cell line was transiently transfected with constructs for expression of wild‐type PDIA3‐V5 or PDIA3C57Y‐V5, or empty vector (Mock). Western blot analysis of immunoprecipitation of V5‐tag to measure PDIA3 interaction with calnexin (CNX) and calreticulin (CRT) at 48 h after transfection. Representative image of three independent experiments.
-
ENSC‐34 cells were transiently transfected with constructs for expression of wild‐type PDIA3‐V5, PDIA3C57Y‐V5, PDIA3R282A‐V5, or PDIA3C57Y/R282A‐V5. Filter‐trap analysis under non‐reducing conditions was performed at 48 h after transfection. β‐actin was employed as loading control. Representative image of three independent experiments.
-
FHEK cell line was transiently transfected with constructs for expression of wild‐type PDIA3‐V5 or PDIA3C57Y‐V5, or empty vector (Mock). Native filter‐trap analysis of immunoprecipitation of V5‐tag to measure CNX interaction with PDIA3 aggregates at 48 h after transfection. Representative image of three independent experiments.
-
GNSC‐34 cells were transfected with constructs for expression of wild‐type PDIA3‐V5 or PDIA3C57Y‐V5, or empty vector (Mock). Fluorescence micrographs with XZ and YZ orthogonal views from Z‐stacks of seven confocal planes show co‐localization of V5 and BiP immunostaining. Bottom images are digital magnifications of cells indicated with white asterisks. Arrowhead points to PDIA3C57Y‐V5 puncta positive for BiP. Scale bar 5 μm. Representative image of three independent experiments.
-
HPurified recombinant wild‐type PDIA3 and PDIA3C57Y were treated with proteinase K and analyzed by SDS–PAGE with Coomassie blue staining. *, undigested protein. **, main fragment of PDIA3C57Y digestion. Representative image of four independent reactions.
-
IRelative thiol oxidase activity of recombinant wild‐type PDIA3 and PDIA3C57Y using NRCSQGSCWN as substrate peptide. n = 3 independent reactions. Data are shown as mean ± s.e.m. and statistical analysis performed using two‐tailed Student's t‐test.
-
JSDS–PAGE analysis of recombinant wild‐type PDIA3 and PDIA3C57Y under reducing (+β‐me, β‐mercaptoethanol) and non‐reducing (−β‐me) conditions with Coomassie blue staining.
-
KRepresentative traces for binding of 400 nM wild‐type PDIA3 or PDIA3C57Y to immobilized CRT‐P domain using Bio‐Layer Interferometry. A total of five independent measurements were performed.
Source data are available online for this figure.
