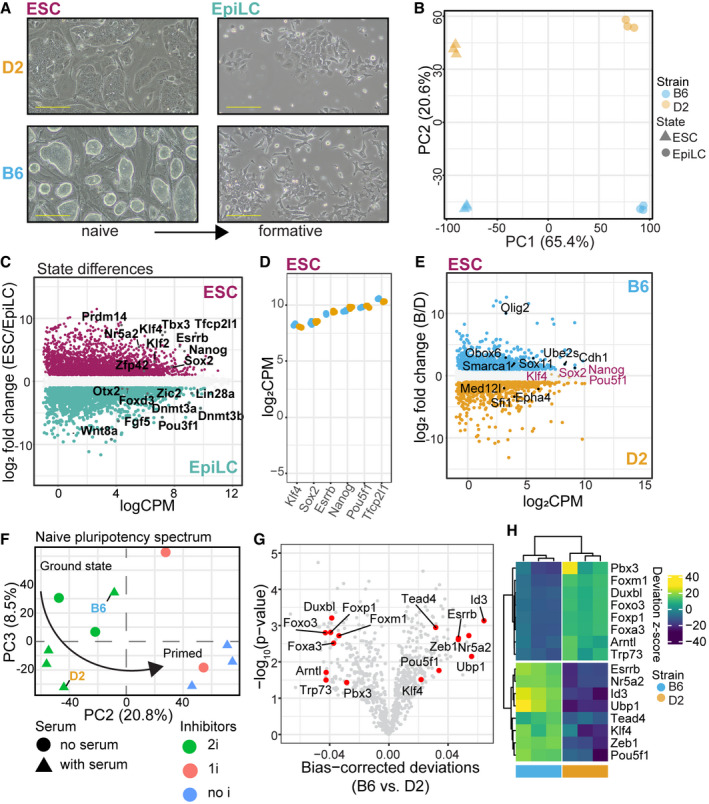
Figure 1. Genetic background influences position within a pluripotency spectrum through differences in chromatin accessibility.

- Phase‐contrast images of representative cultures for B6 and D2 strains maintained in conditions supporting naïve pluripotency and after transitioning to formative EpiLCs. B6 ESC colonies adopt a classical ground state morphology, whereas D2 ESCs grew with a flat morphology and fewer cells per colony. Morphological differences persisted in EpiLCs (scale bar = 50 µm).
- First two principal components show major source of variation in transcript abundance is cell state (PC1, 65.4%) and strain (PC2, 20.6%) for 3 biological replicates of B6 and D2.
- MA plot highlighting genes differentially expressed between state independent of strain (glm state term, false discovery rate‐adjusted P‐value (FDR) < 0.05 and log2FC > 1). Core pluripotent TFs highlighted for each state (maroon = naïve ESCs, teal = formative EpiLCs).
- Scatterplot of expression for core naïve TFs in 3 biological replicate ESCs per strain. Equal high expression of naïve TFs observed in both B6 and D2 ESCs.
- MA plot showing differentially regulated genes between strains within ESCs as determined by pairwise comparison (FDR < 0.05 and logFC > 1). Core naïve TFs are highlighted as not significantly differentially expressed between strains. Genes significantly different between strains within cell state with known roles in promoting naïve pluripotency (B6 = Obox6, Cdh1, Smarca1, Ube2s; D2 = Med12l, Sfi1) and self‐renewal in progenitor cell populations are highlighted (B6 = Olig2, Sox11; D2 = Epha4).
- PCA of full transcript abundance comparing average expression from B6 and D2 ESCs (3 biological replicates) collected here to previously collected RNA‐seq from Hackett et al (2017). PC1 separated experimental origin, indicating batch effects between laboratories, and was not explored further. B6 expression was similar to that of ground state conditions, which exclude serum, whereas D2 expression more closely resembled conditions that include serum. Arrow indicates developmental progression toward primed pluripotency.
- Volcano plot showing the mean difference in bias‐corrected accessibility at TF motifs from ATAC‐seq (3 biological replicates) versus P‐value for that difference. Select TFs critical to pluripotency and differentiation are highlighted.
- Heatmap of motif deviations from 3 biological replicates of B6 and D2 ESCs for TFs highlighted in (G).
