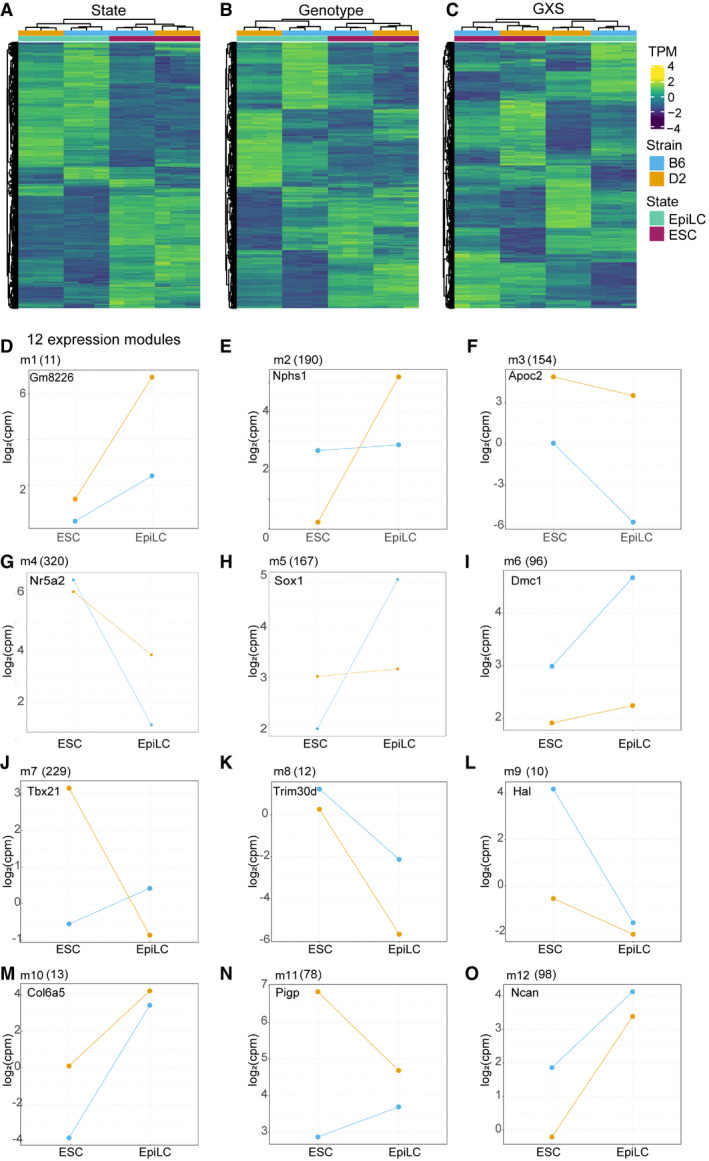
Figure EV2. Genetic background induces distinct expression pattern changes across cell state transition.

-
A–CHeatmaps showing expression patterns for genes detected with a significant difference based on general linearized model (glm, state + strain + stain x strain). Hierarchical clustering of samples (columns) results in proper association of cell states and biological replicates within genotype. (A) Genes with significant difference between cellular states independent of genetic background (n = 10,380 at FDR < 0.05). (B) Genes with significant difference between strains independent of state (n = 7,359 at FDR < 0.05). (C) Genes with significant interaction between state and strain (n = 4,912 at FDR < 0.05).
-
D–OCandidate gene expression patterns between genotype and state represent expression modules m1‐12. Modules resulted from intersection between EBseqHMM‐defined expression paths and genes with a significant GxS interaction. Number of genes within each module indicated at top in parentheses.
