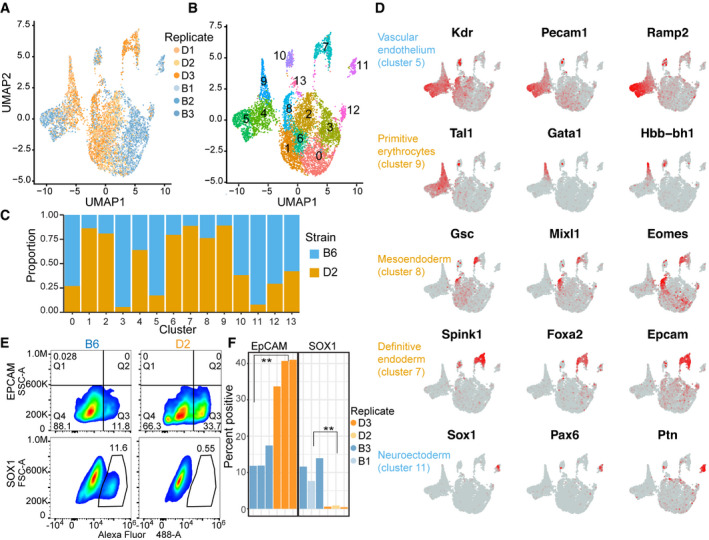
UMAP embeddings of transcriptional profiles from spontaneously differentiated embryoid bodies (EBs). Each point represents a cell colored by genetic background and shaded by biological replicate (N = 3).
Similar to (A) indicating 13 major cell populations based on unsupervised clustering. Each cell is colored based on cluster.
Proportion of cells in a given cluster from (B) represented by either B6 or D2 genetic background.
Feature plot of expression gradients for indicated gene overlaid on UMAP from (A). Three lineage markers that help to distinguish cellular identity are shown for five cell clusters.
Pseudocolor plots of FACS analysis on cells from EBs for both B6 and D2 strains. Cells were labeled with anti‐EpCAM (top) or biological replicates with anti‐SOX1 antibody (bottom). Gated population indicates percentages of EpCAM+ (Q3) or SOX1+ cells.
Bar chart showing percent positive cells gated for EpCAM+ population (left) or SOX1+ population (right). As predicted by scRNA‐seq, more D2 EB cells express EpCAM compared with B6 and more B6 EB cells express SOX1 compared with D2 (N = 3, two‐sided t‐test, EpCAM P‐value = 0.0012, and SOX1 P‐value = 0.0048).

