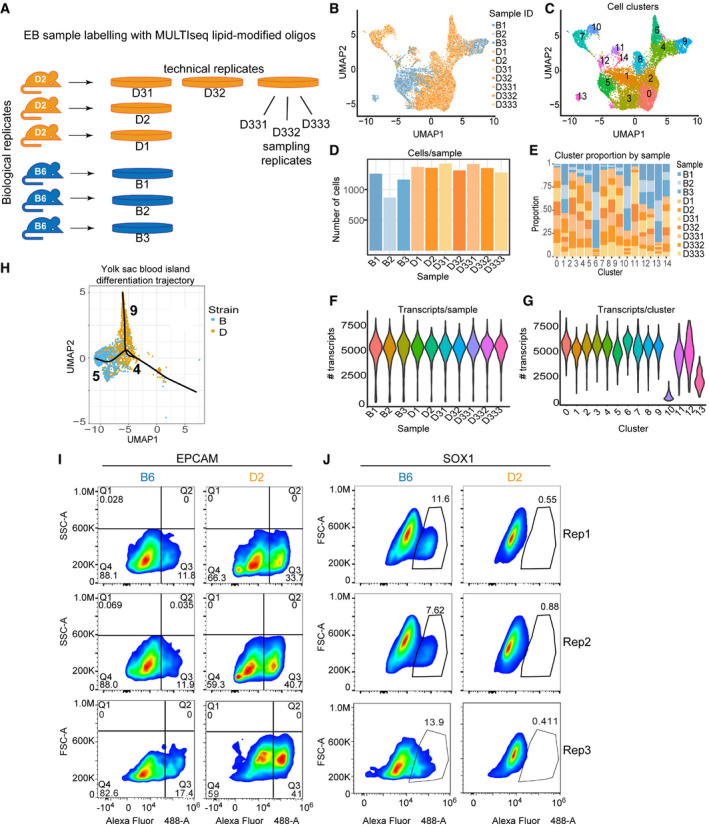
Figure EV3. Spontaneous differentiation of ESCs to EBs identifies divergent developmental trajectories between B6 and D2 strains.

-
AExperimental design to assess reproducibility of EB formation and scRNA‐seq characterization of cell proportions. Reproducibility was accessed by growing (i) three biological replicates (originating from independently derived ESC lines), (ii) one ESC cell line grown for three technical replicates, and (iii) sampling replicates (pool of disaggregated EBs sampled three times). Each replicate was barcoded using lipid‐modified oligonucleotides, pooled, and loaded onto a single 10X Chromium microfluidic lane.
-
BUMAP embeddings for all 10 scRNA‐seq libraries colored by individual replicate. Each dot represents a single cell. Cells from replicate EBs clustered in proximity demonstrating reproducibility.
-
CSimilar to (B), UMAP embeddings of cell clustering based on transcript abundance for all 10 samples.
-
DNumber of cells per sample shown for each sample in (B).
-
EProportion of cells within each cluster color coded by sample in (B). Overall, biological, technical, and sample replicates made up similar proportions of clusters. Because technical and sampling replicates were collected from D2 ESCs, downstream analysis for Fig 3 was performed with only 3 biological replicates for each genotype in order to allow comparisons between similar cell numbers.
-
FViolin plot of all 10 samples in (B) indicating the distribution of number of transcripts per sample.
-
GViolin plot indicating number of transcripts per cluster from 6 samples (3 biological replicates per strain) represented in UMAP shown in Fig 3B. Clusters 10 and 13 had fewer transcripts compared with all other clusters. Attempts at annotation of these two clusters mostly identified cellular processes instead of obvious cellular lineages.
-
HUMAP embeddings showing individual cells for clusters 4, 5, and 9 from Fig 3B. Trajectory of pseudotime analysis based on gene expression, using Slingshot, is overlaid on UMAP. Cluster 4 represents yolk sac blood island cells, which are common progenitors of vascular endothelium (cluster 5) and primitive erythrocytes (cluster 9).
-
I, JPseudocolor plots for replicate FACS analysis on cells from EBs for both B6 and D2 strains. Cells from technical and biological replicates were labeled with anti‐EpCAM (I) and anti‐SOX1 antibody (J). Gated population indicates percentages of EpCAM+ (Q3) or SOX1+ cells. Replicate 1 is redisplayed here from Fig 3E to show with the other replicates.
