-
A
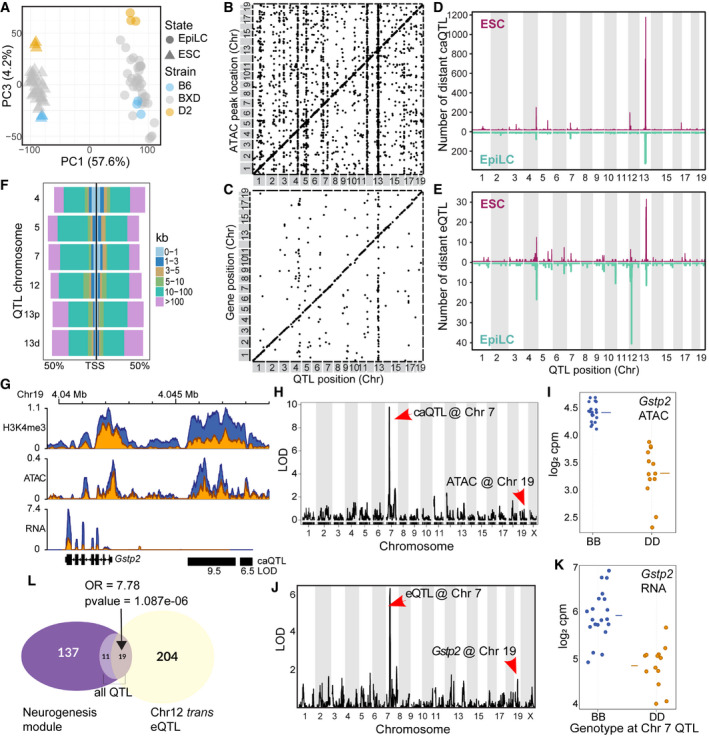
PCA of total transcript abundance in ESCs and EpiLCs from parental (3 biological replicates) and 33 distinct recombinant inbred BXD strains generated from crosses between B6 and D2. PC1 captures variation between cell state (57.6%), and PC3 captures transcript variation within cell states.
-
B
Scatterplot of genomic locations of individual chromatin accessibility (ca)QTL (x‐axis, LOD > 5) versus location of ATAC peak being regulated (y‐axis) for ESCs. Genetic effects that act locally (n = 3,973), i.e., in cis, fall on the diagonal line, while distal‐acting QTL (n = 13,767) lie off the diagonal. Several prominent distal‐QTL hotspots appear as vertical lines.
-
C
Similar to (B), plotting expression (e)QTL position versus gene location (LOD > 5, n = 701 local‐eQTL, n = 357 distal‐eQTL).
-
D
Number of distal‐caQTL in 1 Mb windows versus genomic location mapped in ESCs (maroon) and EpiLCs (teal).
-
E
Similar to (D) comparing eQTL location and number between ESCs and EpiLCs.
-
F
Distribution of caQTL hotspot targets in relation to nearest transcription start site in ESCs as percentage of total targets.
-
G
Coverage profile for Gstp2 locus on Chr 19 showing H3K4me3, ATAC, and RNA read depth from merged replicates. Locations of Chr 7 trans‐caQTL targets are indicated with black bars and LOD scores listed below.
-
H
LOD score plot from QTL scan in ESCs for chromatin accessibility at the putative enhancer at Gstp2. Genetic variation at Chr 7 QTL distally regulates chromatin accessibility on Chr 19.
-
I
Phenotype by genotype plot of the Chr 7 caQTL from h. A B6 haplotype at Chr 7 is associated with increased chromatin accessibility on Chr 19 (horizontal line represents mean).
-
J, K
Similar to H&I showing QTL mapping and haplotype effect for expression of Gstp2 in ESCs (horizontal line represents mean).
-
L
Euler diagram showing overlap between genes in the neurogenesis module (m5 from Fig
2H) and Chr 12
trans‐eQTL (LOD > 4) in EpiLCs (enrichment compared to all eQTL in neurogenesis module, Fisher’s exact test—odds ratio (OR) = 7.78,
P‐value = 1.087e‐06).

