
Figure 5. trans‐QTL regulate chromatin binding of transcription factors required for pluripotency and differentiation.
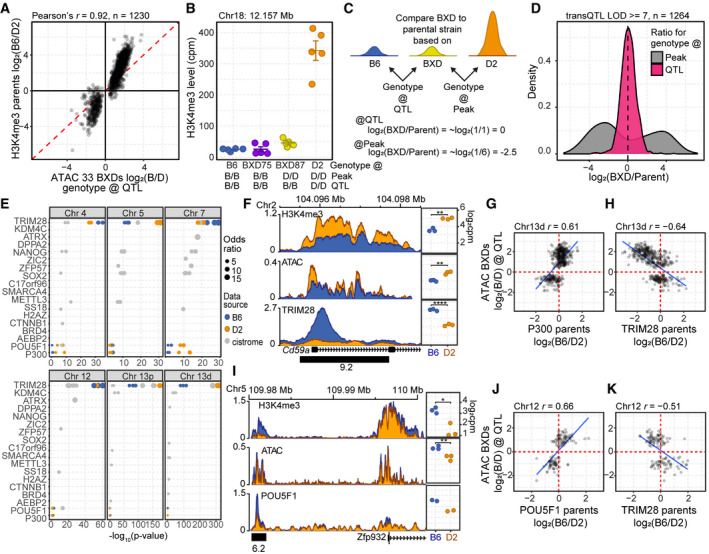
- Scatterplot of difference in chromatin accessibility in the 33 BXD inbred versus difference in H3K4me3 modification in the parental strains for trans‐caQTL (LOD ≥ 8). ATAC‐seq signal represents the log2 ratio of the average signal based on the genotype at the QTL.
- H3K4me3 level is predicted by the genotype at the QTL versus local genotype. H3K4me3 ChIP‐seq for B6 and D2 parental lines compared with two BXD strains (mean ± SEM). Genotypes for both the location of the peak and location of the QTL are indicated below.
- Scheme to determine whether local (peak) or distal (QTL) genotype predicts chromatin state. A ratio of ~1 (log2(ratio) ≈ 0) indicates similar chromatin modification.
- Log2 fold change of H3K4me3 level when comparing BXD75 or BXD87 to the parental genotype either at the location of the peak or based on the genotype at the QTL for all trans‐caQTL for which the local genotype and QTL genotype differ (LOD score ≥ 7).
- Gray—Publicly available ESC ChIP‐seq datasets were evaluated for significant overlap of QTL targets (Fisher’s exact test, top ten factors with q‐value cutoff < 0.01). To validate a subset of these results, ChIP‐seq was performed for TRIM28 (N = 3), POU5F1 (N = 2), and P300 (N = 2) in B6 (blue) and D2 (orange) ESCs. Each circle represents a biological replicate or independent ChIP‐seq accession from Cistrome.
- Left—Coverage profiles (averaged biological replicates, N = 3) for ChIP factor occupancy at Cd59a on Chr 2 under trans‐regulation by the Chr 13d QTL. Distal‐caQTL target region used for quantification is indicated by a black box with LOD score below. Right—Scatterplots for ChIP factors comparing quantitative level of modification/binding for independent replicates between B6 and D2 ESCs.
- The difference in occupancy of P300 in the parental strains is correlated to difference in chromatin accessibility in the 33 BXDs based on the genotype of the BXD at the QTL for Chr 13 caQTL targets (LOD > 7, Pearson’s r = −0.61).
- TRIM28 occupancy at the same targets of Chr 13d caQTL in (F) was negatively correlated with ATAC signal (Pearson’s r = −0.64).
- Similar to (F), coverage profiles for ChIP factor occupancy for a putative regulatory element on Chr 5 near Zfp932, targeted by Chr 12 trans‐caQTL, showed greater occupancy of POU5F1 and increased open chromatin compared with D2. Distal‐caQTL target region used for quantification is indicated by a black box with LOD score below.
- The difference in occupancy of POU5F1 in the parental strains is correlated to difference in chromatin accessibility in the 33 BXDs based on the genotype of the BXD at the QTL for Chr 12 caQTL targets (LOD > 7, Pearson’s r = −0.66).
- Similar to (J) showing negative correlation between TRIM28 occupancy and chromatin accessibility (Pearson’s r = −0.51).
Data information: P‐values in (E, H) represent two‐sided t‐test, *< 0.05, **< 0.01, ****< 0.0001)