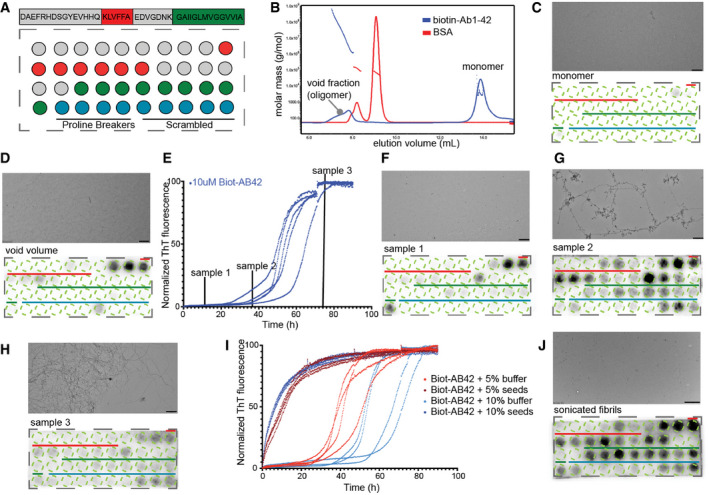
Figure 1. Differential binding of Aβ‐aggregating species in Aβ cellulose peptide microarrays.

-
AAβ1‐42 sliding window membrane setup. Red indicates where the KLVFFA starts presented whole. Green where GAIIGL presented whole. Blue indicates the controls (4 proline breakers, 5 scrambled Aβ peptides, sequences Appendix Table S1).
-
BSEC‐MALS of Biot‐Aβ1‐42 preparation with 7 M GnHCL showing a clear monomeric peak and a smaller oligomeric.
-
C100 nM of Biot‐Aβ1‐42 monomers show no binding on membrane (down panel), TEM image shows no aggregating species in the sample (upper panel). Scale bar: 500 nm.
-
DVoid fraction (oligomers) shows strong binding on first APR of Aβ1‐42. Scale bar: 500 nm.
-
ENormalized ThT kinetics of 10 μM Biot‐Aβ1‐42 with timepoints of samples that incubated with Aβ1‐42 membranes.
-
F–HBinding of different aggregating samples to Aβ membranes and their TEM images. 100 nM of sample1 (early oligomers) binds strongly to middle APR (F), 100 nM of sample 2 (late oligomers) binds in both middle and C‐terminal APR of Aβ1‐42 (down panel) while TEM images show fibrillar structures (upper panel) (G), 100 nM of sample 3 shows no specific binding to Aβ1‐42 membranes (H). Scale bars: 500 nm.
-
IThT kinetics of Biot‐Aβ1‐42 seeding. 10 μM of Biot‐Aβ1‐42 incubated with 0.5 or 1 μM of Biot‐Aβ1‐42 seeds.
-
J100 nM of Biot‐Aβ1‐42 seeds show a strong binding in both APRs. TEM image (upper panel) slow clear fragmentation of fibrils. Scale bar: 1 μm.
