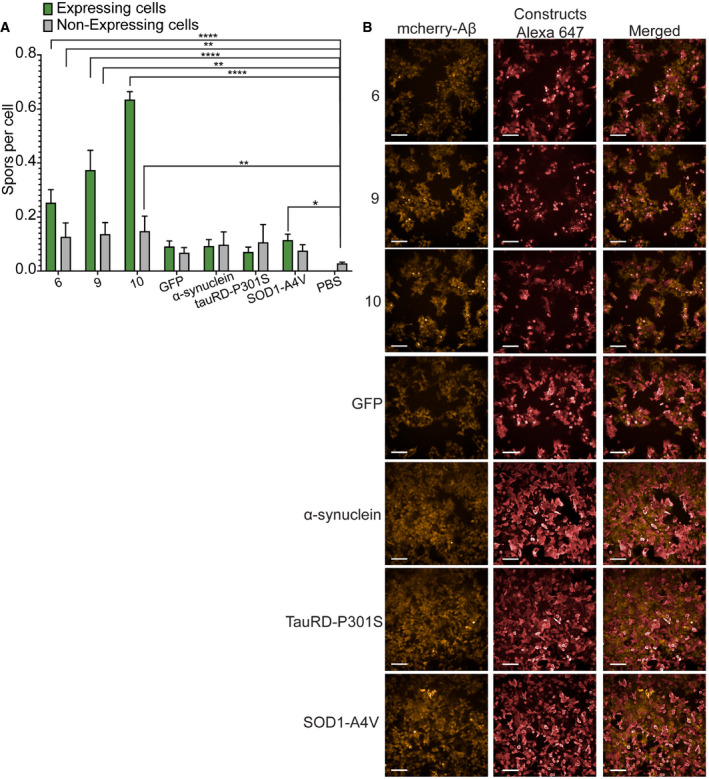
Figure EV2. Effect of expression of amyloidogenic proteins in aggregation of Aβ.

- Quantification of spots per cell for aggregation inducer constructs (6, 9, 10) and known amyloidogenic proteins (α‐synuclein, tauRD‐P301S, SOD1‐A4V). Graph: mean with 95% CI. (n = 4 independent experiments, statistics: ordinary one‐way ANOVA). *P ≤ 0.05, **P ≤ 0.01, ****P ≤ 0.0001.
- Representative images of cells expressing the different constructs. mCherry indicates Aβ, Alexa647 the constructs. Scale bars: 100 μm.
