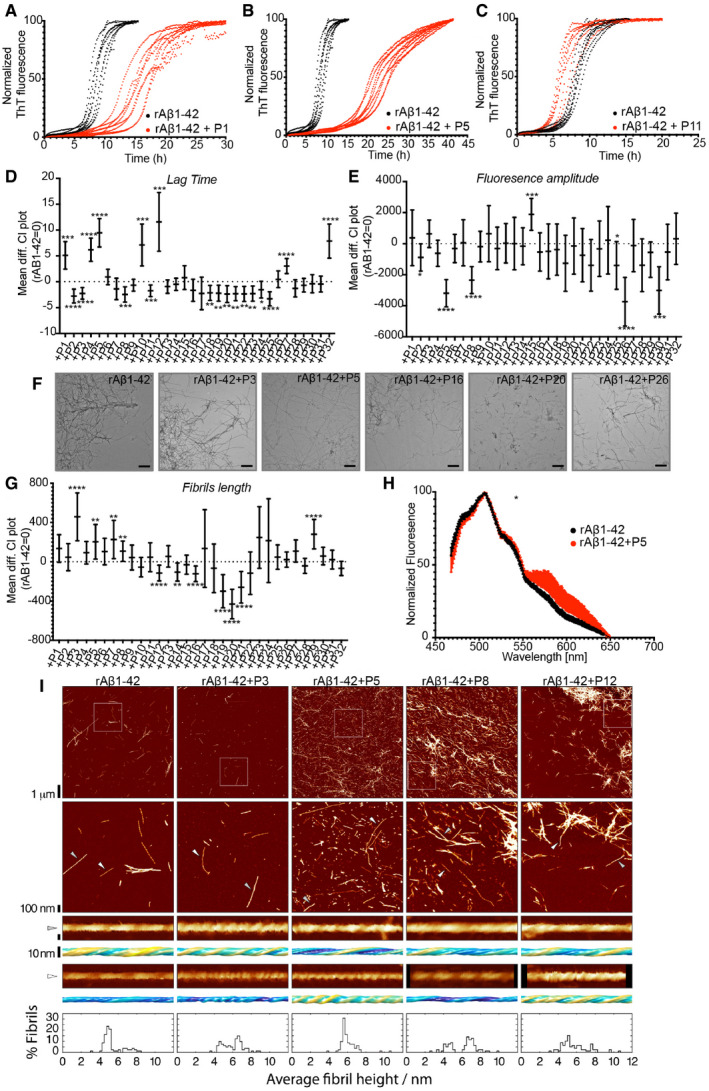
Figure 3. Homologous peptides can affect rAβ1‐42 kinetics and resulting fibril morphology.

- A–C
-
DLag time difference between rAβ1‐42 alone (rAβ1‐42 = 0) and in the presence of peptides (Statistics: Brown–Forsythe and Welch ANOVA tests with Dunnett’s T3 multiple comparison corrections, n = 2 independent experiments with 4 repeats).Graph: Mean difference and 95% CI. *P ≤ 0.05, **P ≤ 0.01, ***P ≤ 0.001, ****P ≤ 0.0001.
-
EFluorescence amplitude difference between rAβ1‐42 alone (rAβ1‐42 = 0) and in the presence of the peptides (Statistics: Brown–Forsythe and Welch ANOVA tests with Dunnett’s T3 multiple comparison correction, n = 2 independent experiments with 4 repeats). Graph: Mean difference and 95% CI. *P ≤ 0.05, ***P ≤ 0.001, ****P ≤ 0.0001.
-
FRepresentative TEM images of fibrils made in the presence of 1:1 rAβ1‐42:peptides. Scale bars: 500 nm.
-
GFibril length difference between Aβ alone and in the presence of peptides (Statistics: Brown–Forsythe and Welch ANOVA test with Games‐Howell multiple comparison correction). Graph: Mean difference and 99% CI. **P ≤ 0.01, ****P ≤ 0.0001. At least 9 different positions on grid and at least 100 fibrils were counted for each condition (except Aβ+P23, Aβ+P24). Fibril length distribution in Appendix Fig S7.
-
HCurcumin binding to Aβ fibrils alone or in presence of P5. (n = 2, at least 4 repeats, statistics: Kolmogorov‐Smirnov test). Graph: mean ± SD. P = 0.049. Reused image in Appendix Fig S9.
-
IRepresentative AFM height images of Aβ fibrils alone or in a 1:1 mixture with P3, P5, P8 and P12 peptides are shown in the top row. The boxes indicate the magnified regions shown in the second row. Arrows indicate the locations of representative individual fibrils shown in magnified detail, each shown as a 200 nm digitally straightened segment and a 100 nm segment of the corresponding 3D surface envelope model that was calculated from the image data. The scale bar for each row is shown to the left, with both the 3D model and the straightened image data representing 10 nm. The colour scale of the 3D models from blue to yellow indicates the distance (from low to high) between the fibril surface and fibril centre axis to demonstrate their twist patterns. The average fibril height distribution of around 80 manually selected filaments per sample that showed twist patterns characteristic of single, not fragmented, amyloid fibrils are shown in the bottom row.
