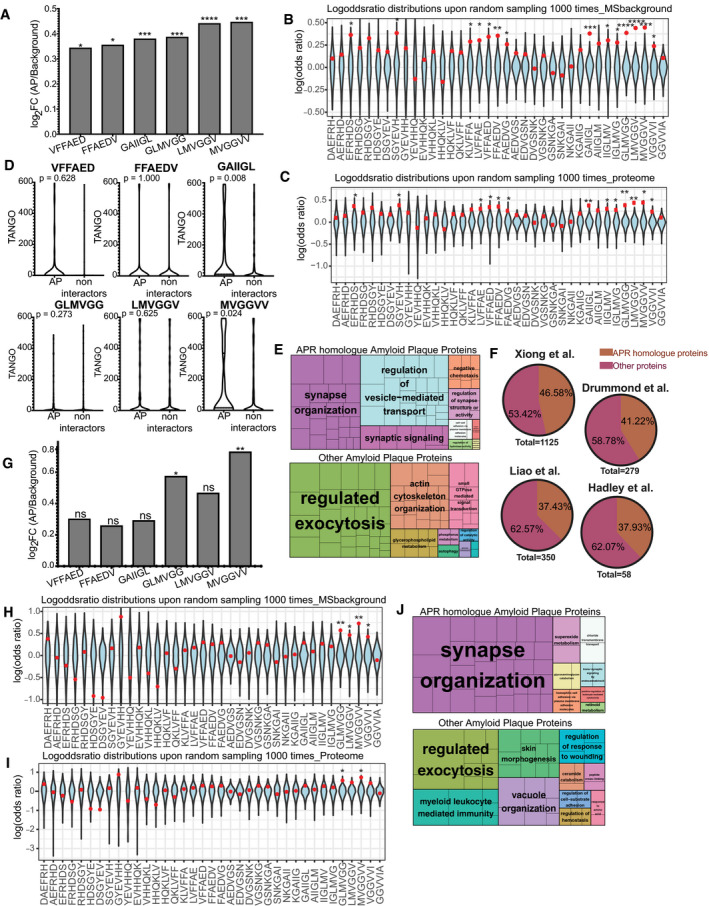
Over‐representation of Aβ APRs in amyloid plaques of AD brains (statistics: hypergeometric test with Bonferroni correction) *
P ≤ 0.05, ***
P ≤ 0.001, ****
P ≤ 0.0001. The original data were taken from Xiong
et al (
2019a,
b) and included three biological replicates.
Log‐odd ratio of random sampling from mass spectrometry background. In blue is the distribution upon random sampling (×1,000) from tissue proteins. Red dot indicates the true values of analysis. In APR regions the actual value (red) resides either in the edges or outside of the random distribution. (statistics: Z‐test). *P ≤ 0.05, **P ≤ 0.01, ***P ≤ 0.001, ****P ≤ 0.0001.
Log‐odd ratio of random sampling from human proteome. In blue is the distribution upon random sampling (x1000) from proteome. Red dot indicates the true values of analysis. (statistics: Z‐test) *P ≤ 0.05, **P ≤ 0.01.
TANGO scores of homologue APRs in amyloid plaques and non‐amyloid plaques proteins. (statistics: Kolmogorov–Smirnov test).
Biological pathways enrichment of Aβ APR homologue‐related and non‐related proteins derived from AD amyloid plaques.
APR homologue proteins identified in other MS studies.
Over‐representation of Aβ APRs in amyloid plaques of non‐AD brains. (statistics: hypergeometric test with Bonferroni correction). *
P ≤ 0.05, **
P ≤ 0.01 The original data were taken from Xiong
et al (
2019a,
b) and included three biological replicates.
Log‐odd ratio of random sampling from mass spectrometry background. In blue is the distribution upon random sampling (×1,000) from tissue proteins. Red dot indicates the true values of analysis. (statistics: Z‐test) *P ≤ 0.05, **P ≤ 0.01.
Log‐odd ratio of random sampling from human proteome. In blue is the distribution upon random sampling (×1,000) from proteome. Red dot indicates the true values of analysis. (statistics: Z‐test) *P ≤ 0.05, **P ≤ 0.01.
Biological pathways enrichment in of Aβ APR homologue‐related and non‐related proteins derived from non‐AD amyloid plaques.

