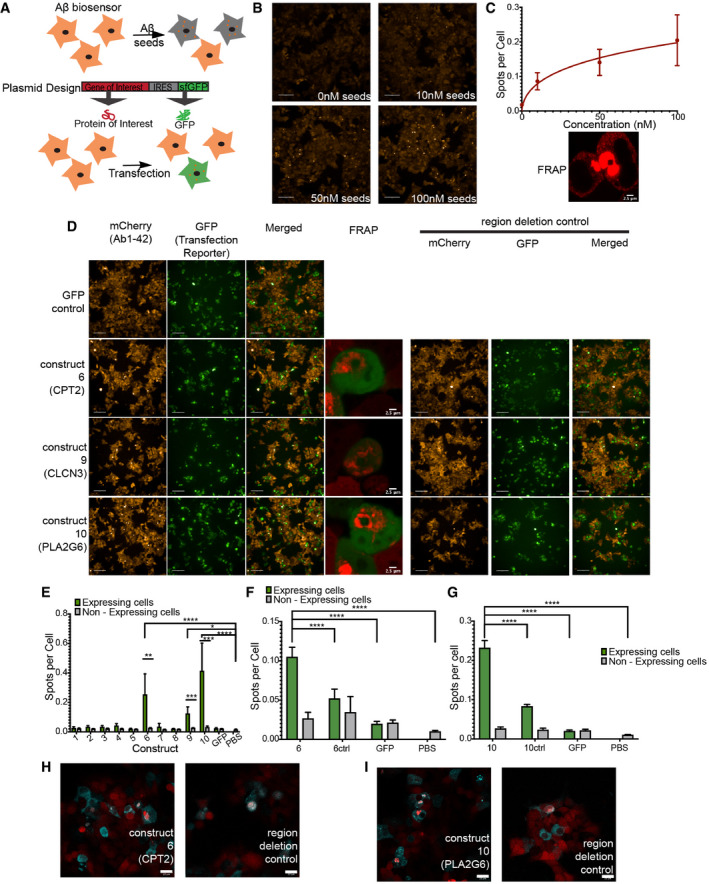
Figure 6. Proteins with homologues to Aβ regions can induce the aggregation of Aβ1‐42 in HEK293T cells Aβ biosensor.

-
AExperimental setup of inducing aggregation in Aβ biosensor cell line.
-
BRepresentative images of Aβ biosensor seeding with three different seed concentration (10, 50, 100 nM) Scale bars: 100 μm.
-
CTreating Aβ biosensor with different concentrations of rAβ1‐42 seeds induces the aggregation of mCherry‐Aβ1‐42 in a dose‐dependent matter (n = 3 independent experiments, graph: mean and 95% CI). FRAP of Aβ spots shows limited recovery confirming that are aggregates (in detail at Appendix Fig S10B and C). Scale bar: 2.5 μm.
-
DRepresentative images of three proteins that can induce aggregation of Aβ1‐42 in biosensor cell. Increased aggregation is observed in cells expressing the construct but not GFP alone (left panels). Scale bar: 100 μm. FRAP of the resulting aggregates shows no recovery (in detail at Appendix Fig S11). Scale bar: 2.5 μm Removal of the homologue regions resulting in reduced aggregation (right panels). (n = 3 independent experiments).
-
EQuantification of a number of spots per cell in cells expressing/not expressing the construct (identified by GFP, transfection reporter) (n = 3 independent experiments, statistics: ordinary one‐way ANOVA with Dunnett’s T3 multiple comparison correction, unpaired t‐test for transfected/non‐transfected cells). Bar plot: mean with 95% CI. *P ≤ 0.05, **P ≤ 0.01, ***P ≤ 0.001, ****P ≤ 0.0001.
-
F, GQuantification of Spots per cell for construct6 and construct6 control (6Ctrl, removal of homologue region) (F) and construct10 and construct10 control (10ctrl, removal of homologue region) (G). (n = 4 independent experiments, statistics: ordinary one‐way ANOVA). Bar plot: mean with 95% CI. ****P ≤ 0.0001.
-
H, IConfocal images of colocalization of protein of interest with Aβ aggregates. (Contrast of images were enhanced to 0.1% saturated pixels using Fiji). Scale bars: 22 μm.
