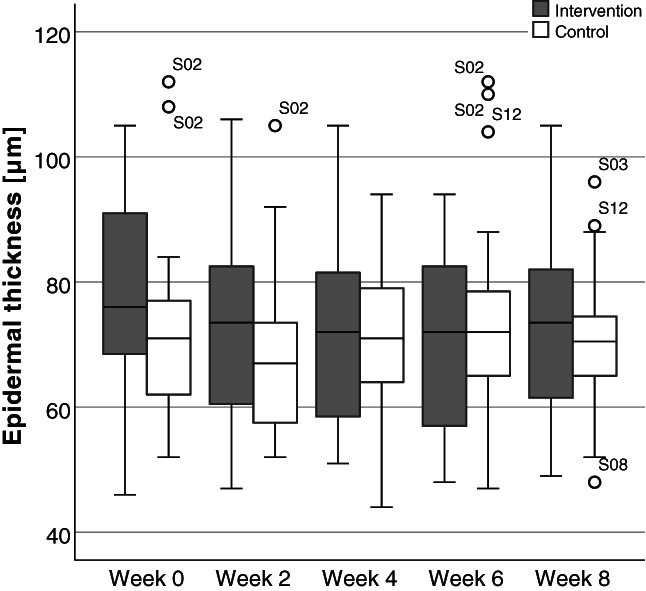
FIGURE 4.

Boxplot representation of epidermal thickness. Epidermal thickness values expressed in micrometres (μm). Standardised thickness measurements based on duplicate optical coherence tomography images for all subjects on intervention and control arms at week 0, 2, 4, 6, and 8
