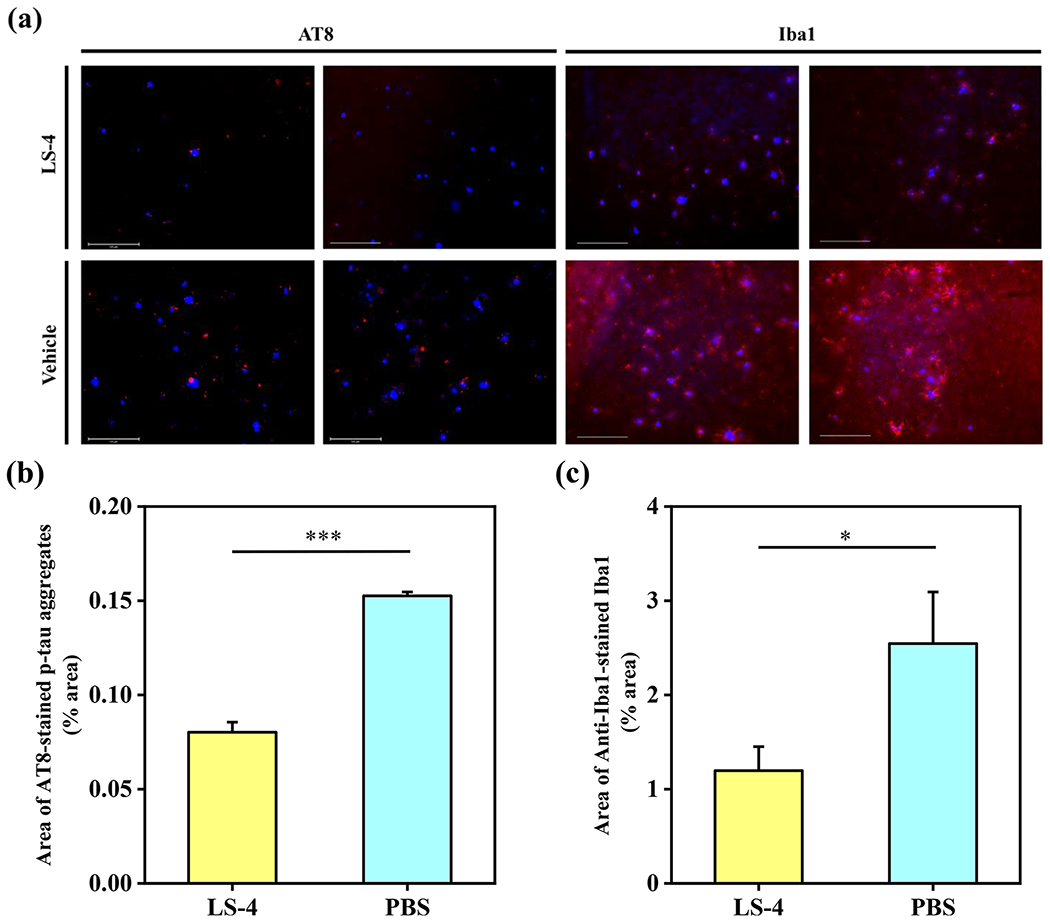
Figure 10.

(a) Representative fluorescence microscopy images of the CF594-AT8 and CF594-Iba1 immunostained brain sections from 5xFAD mice treated with LS-4 and vehicle. All fluorescence images are the maximum intensity projection images obtained from 30 Z-sections collected at 1 μm intervals. Color: red, CF594-Iba1 or CF594-AT8 antibody; blue, ThS. Scale bar: 125 μm. (b) Quantification of the area of CF594-AT8 immunostained brain sections from 5xFAD mice. All data were obtained from 8 brain sections per mice. For each brain section, four random areas across cortex regions were chosen. Error bars represent the standard deviation (LS-4 treated mice, n = 4, vehicle-treated mice, n = 3), and the statistical analysis was evaluated according to one-way ANOVA (***p < 0.001). (c) Quantification of the area of CF594-Iba1 immunostained brain sections from 5xFAD mice. All data were obtained from 8 brain sections per mice. For each brain section, four random areas across cortex region were chosen. Error bars represent the standard deviation (LS-4 treated mice, n = 4, vehicle-treated mice, n = 3), and the statistical analysis was evaluated according to one-way ANOVA (*p < 0.05).
