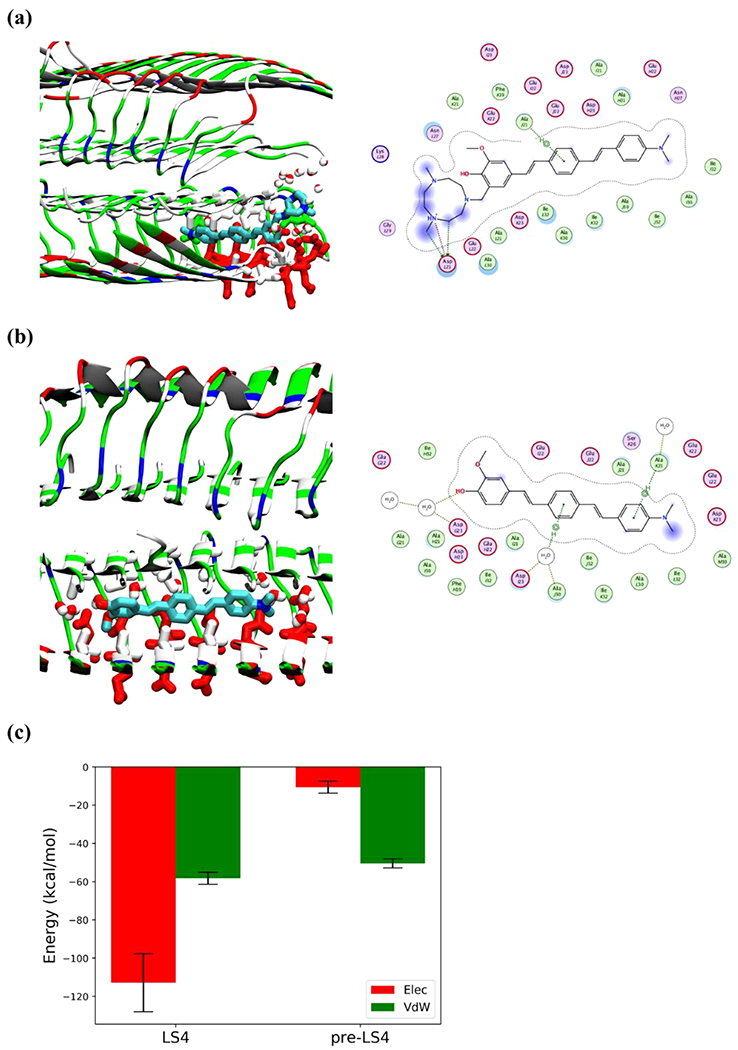
Figure 11.

Detailed interactions of LS-4 and Pre-LS-4 docked onto the Aβ fibril after 100 ns simulations. Compounds are shown by licorice representation colored by atoms (C: cyan, N: blue, O: red), the water molecules and amino acid side chains within 3 Å of the compounds are displayed by licorice representation. Acidic, basic, polar, and nonpolar amino acid residues are shown in red, blue, green, and white colors, respectively, water molecules are colored by atoms (O: red, H: white). For 2D compound-protein interaction patterns, the close-by protein residues and solvent molecules are shown in proximity around the compound. The compound is annotated with a proximity contour and solvent exposure while the protein residues are also annotated by solvent exposure. The green dotted lines with arrows represent H-bonding with protein side chains, whereas the purple dotted line highlights the presence of a salt bridge. (a) Interaction of LS-4 with the Aβ fibril; (b) Interaction of Pre-LS-4 with the Aβ fibril; (c) Electrostatic and van der Waals interaction energies of LS-4 and Pre-LS-4 with Aβ fibril, averaged over the last 25 ns of the MD simulations.
