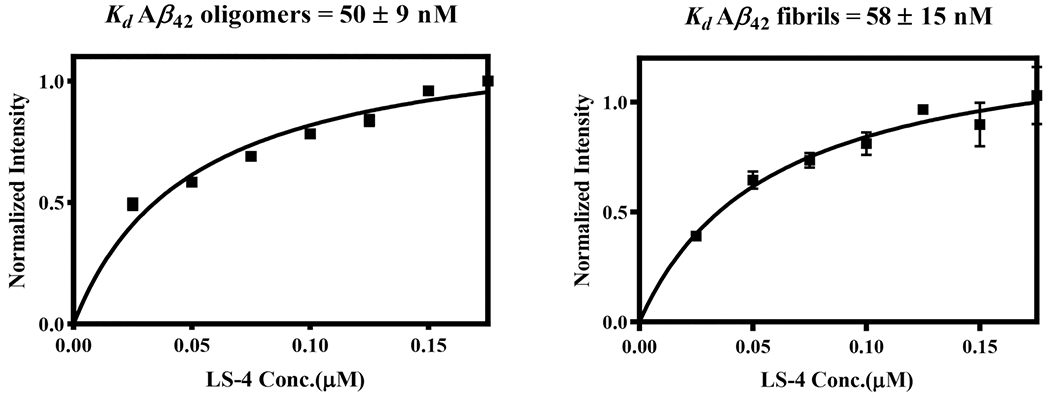
Figure 3.

Direct binding Kd measurements for LS-4 with Aβ42 oligomers (left) and fibrils (right). Each experiment was completed in duplicates, and the error bars represent the standard deviation (n = 3) for the average normalized fluorescence intensities. All data points include error bars, and some of the error bars are smaller than the square symbol.
