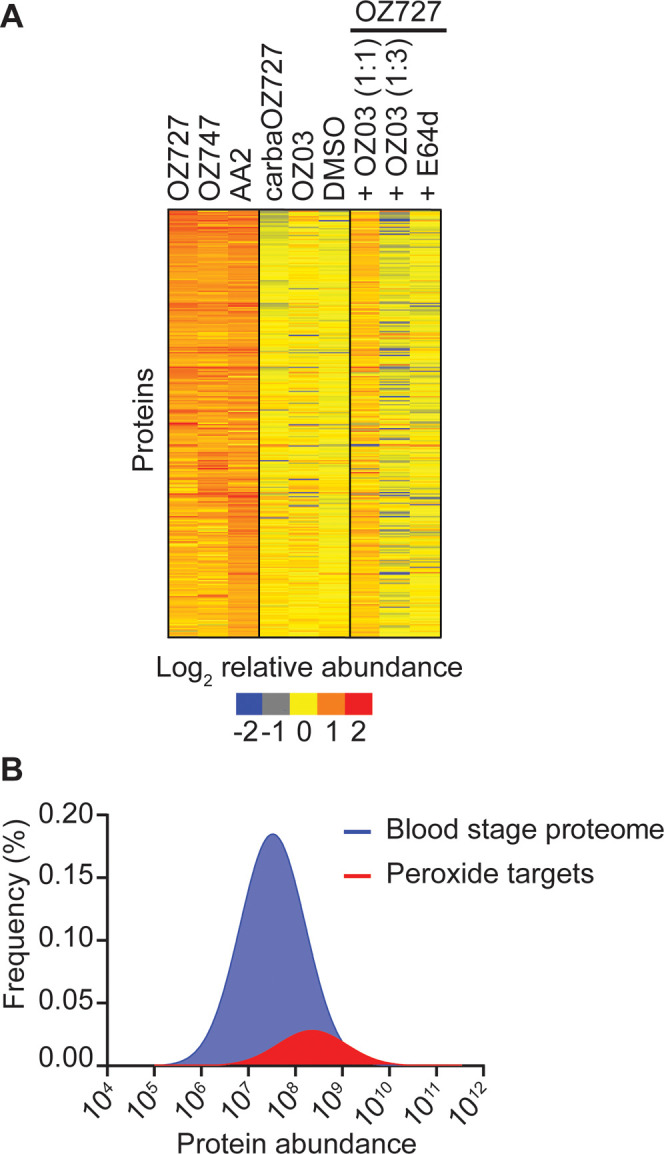
Figure 2.

Proteins enriched by peroxide antimalarials in P. falciparum. (A) Heatmap representation of all proteins enriched by OZ727, OZ747, and AA2 following the treatment of P. falciparum infected RBCs for 1 h (all 300 nM). Heatmap analysis was performed by plotting the average log-transformed protein abundance for each protein and normalizing by the mean for that protein across all samples. Proteins in the OZ727 (n = 6), OZ747 (n = 5), and AA2 (n = 4) groups with a fold-change ≥2 compared to those in the DMSO (n = 9), carbaOZ727 (n = 7), and OZ03 (n = 3) controls, and with a p-value <0.05 (Mann–Whitney U test) compared to that of carbaOZ727 or DMSO, were considered as alkylated proteins. Protein labeling by OZ727 was decreased in the presence of increasing concentrations of the active nonclickable parent ozonide, OZ03 (n = 3–4), and by preincubation of parasite cultures with the cysteine (Cys) hemoglobinase inhibitor, E64d (n = 4). For additional protein information, see Supporting Data 1. (B) Histogram showing that the 436 proteins enriched by the peroxide probes across all study time points (red) are distributed across the P. falciparum blood-stage protein abundance range and not limited to the most abundant proteins within the parasite. The frequency distribution of proteins in the P. falciparum blood-stage proteome (Siddiqui et al., unpublished data) is shown in blue.
