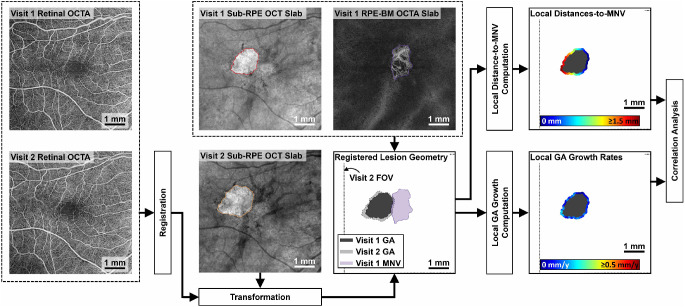
Figure 1.
Overview of the methodology used to assess correlations between local geographic atrophy (GA) growth rates and local distances to the macular neovascularization (MNV). Retinal swept-source optical coherence angiography (SS-OCTA) images from visit 1 and visit 2 were registered using fiducials manually placed at corresponding retinal positions (at retinal vessel bifurcations).22 The estimated registration was then used to transform the visit 2 GA tracings into the visit 1 coordinate frame, allowing the visit 2 GA tracing to be overlaid with the visit 1 MNV and GA tracings. The registered lesion geometries were then used to compute the local GA growth rates (using the visit 1 and visit 2 GA geometries) and the local distances-to-MNV (using the visit 1 GA and visit 1 MNV geometries) at each visit 1 GA margin position. A correlation analysis was then performed on these paired measurements.

