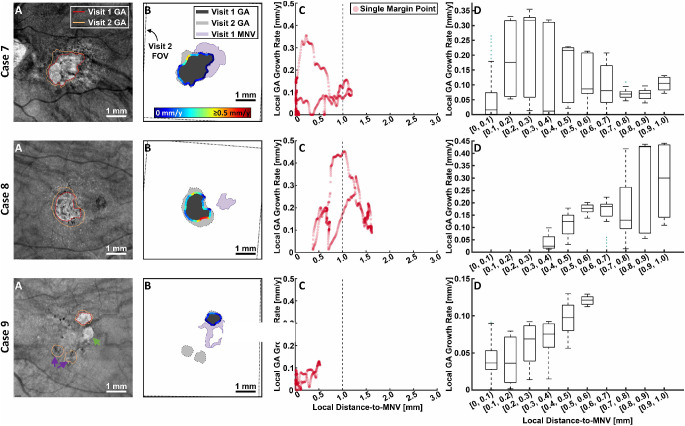
Figure 5.
Analysis of case 4 (row 1), case 5 (row 2), and case 6 (row 3). (A) Visit 1 sub-RPE OCT slab with the visit 1 and visit 2 margins of the geographic atrophy (GA) overlaid. The green arrow in panel A of case 9 points to a region of OCT hyper-transmission that was excluded from the GA tracing because it is surrounded by the MNV lesion (see panel B, same row). The purple arrows in panel A of case 9 points to two newly appearing GA foci, which were not included in the analysis. (B) Local GA growth rates displayed along the visit 1 GA margin (see color bar). (C) Scatterplot of local GA growth rates versus local distances to the macular neovascularization (MNV). The vertical dashed line corresponds to the 1 mm distance-to-MNV. (D) Boxplots, in 100 µm distance-to-MNV intervals, of the local GA growth rates within 1 mm from the MNV. Outliers are indicated by teal markers.

