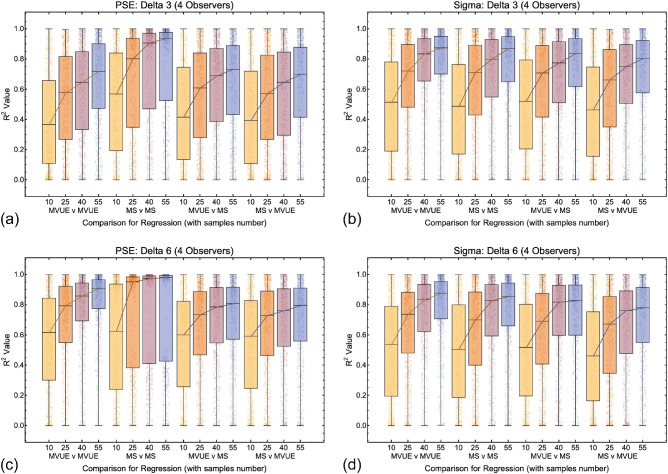
Figure 11.
Box and whisker plots showing the distribution of R2 values for all conditions and comparisons in which there were four simulated observers per experiment for the 3 mm (a and b) and 6 mm (c and d) cue conflict (delta) conditions. The format is the same as Figures 10 and 11.

