
Figure 2.
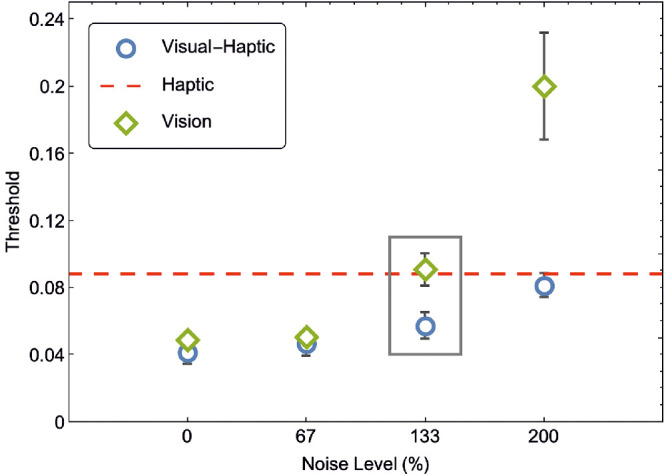
Replot of the threshold data from Ernst and Banks (2002) Figure 3d (see Supplementary Figure S1 for details). The threshold is defined as the difference between the 84% and 50% point of the underlying psychometric cumulative Gaussian function. Thus, smaller thresholds represent more precise perceptual estimates. Thresholds are plotted against the percentage of noise in the visual modality stimulus (see Ernst & Banks, 2002 for full details). The only datapoint which can clearly distinguish MVUE from MS is the 133% noise level stimulus (grey rectangle).