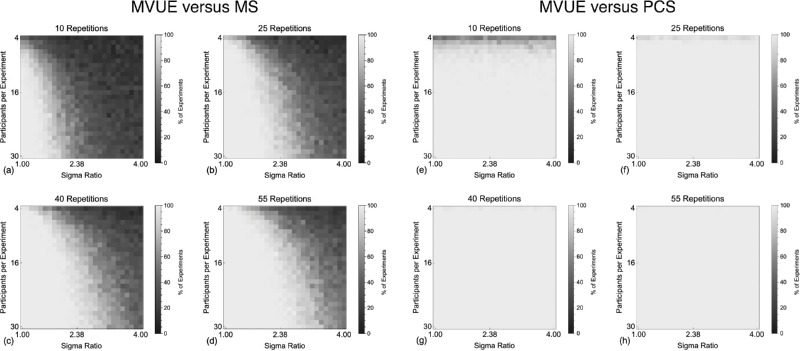
Figure 4.
Shows the percentage of experiments in which the sigmas of the Cumulative Gaussian functions fit to our simulated population of MVUE observers could be statistically distinguished from the experimentally derived prediction of MS (a–d) and PCS (e–h). Pixels in the images show this percentage (as calculated across 100 simulated experiments) for a given sigma ratio and number of participants. This is shown for a and e 10, b and f 25, c and g 40, and d and h 55, simulated trials per stimulus level on the psychometric function.

