
Table 1. Optimization of 7-Azaindoles.
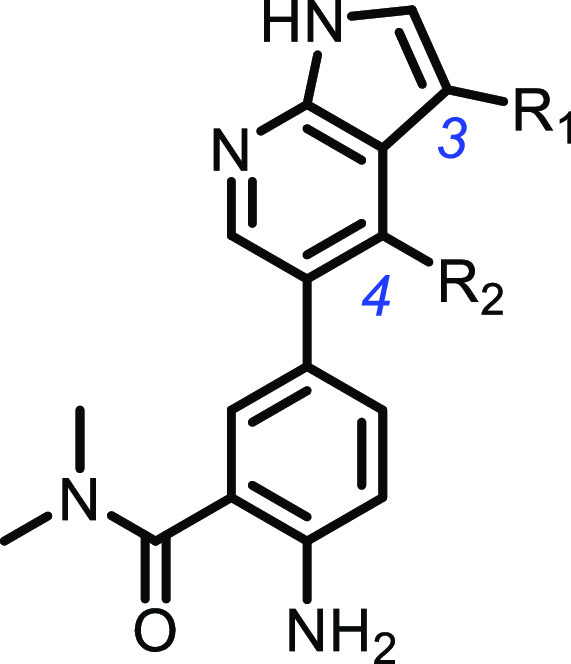
| compd | R1 | R2 | cLogP | HPK1 Ki (nM)a | LLEb | Abl selectivityc | LCK selectivityd |
|---|---|---|---|---|---|---|---|
| 1 | 2-MeOPh | H | 3.1 | 0.4 | 6.3 | <1× | 55× |
| 2 | Et | H | 2.1 | 2.1 | 6.6 | 10× | 237× |
| 3 | H | H | 1.5 | 130 | 5.4 | 66× | |
| 4 | Et | Me | 2.4 | 0.4 | 7.0 | 58× | 808× |
| 5 | Et | Et | 2.8 | 0.2 | 6.9 | 2556× | |
| 6 | Et | Cl | 2.6 | 0.5 | 6.7 | 501× |
a
All apparent Ki values represent arithmetic means of at least two determinations using the HPK1 Lantha binding biochemical assay.
b
LLE, lipophilic ligand efficiency based on HPK1 Ki.
c
Selectivity expressed as the ratio of Abl Ki over HPK1 Ki.
d
Selectivity expressed as the ratio of LCK Ki over HPK1 Ki.