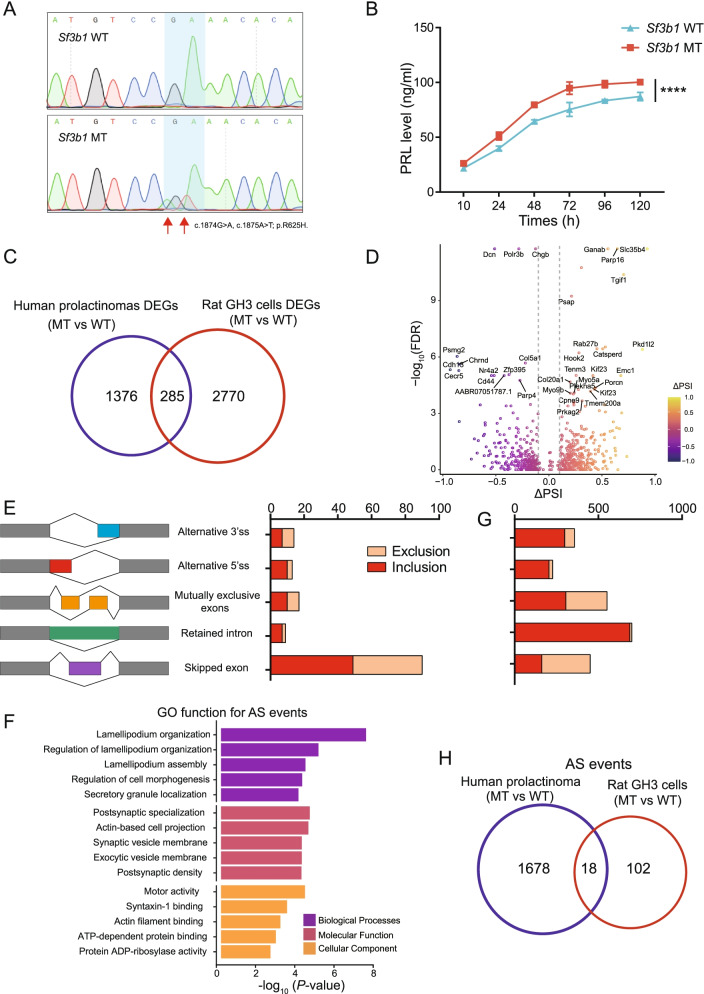
Fig. 1.
Generation of heterozygous Sf3b1-R625H mutant GH3 cells. A Sequencing chromatogram demonstrating the heterozygous Sf3b1-R625H mutation. The homozygous nucleotide in Sf3b1 wild-type GH3 cells and heterozygous nucleotides in Sf3b1 mutant GH3 cells are shown. B PRL secretion in Sf3b1 wild-type and mutant GH3 cells are shown. Data are represented as mean ± SD. (P-values by two-way ANOVA, ****P < 0.0001). C Venn diagram showing the overlapping DEGs identified in SF3B1 mutant human prolactinoma and GH3 cells. D Volcano plot showing the differential alternative splicing events in Sf3b1 mutant vs. wild-type GH3 cells. Significant alternative splicing events identified at FDR < 0.05 and |∆PSI| > 0.1. PSI: Percent Splice In. Top 30 significant mis-spliced genes are indicated. E Number and type of mis-splicing events in Sf3b1 mutant vs. wild-type GH3 cells are shown. Inclusion: events with ΔPSI> 10%; exclusion: events with ΔPSI<− 10% F GO analysis of mis-spliced genes in Sf3b1 mutant vs. wild-type GH3 cells; the top five ranked terms are shown. G Number and type of mis-splicing events in SF3B1 mutant vs. wild-type human prolactinoma. H Venn diagram showing the overlap of mis-spliced genes identified in SF3B1 mutant human prolactinoma and GH3 cells

