Fig. 5.
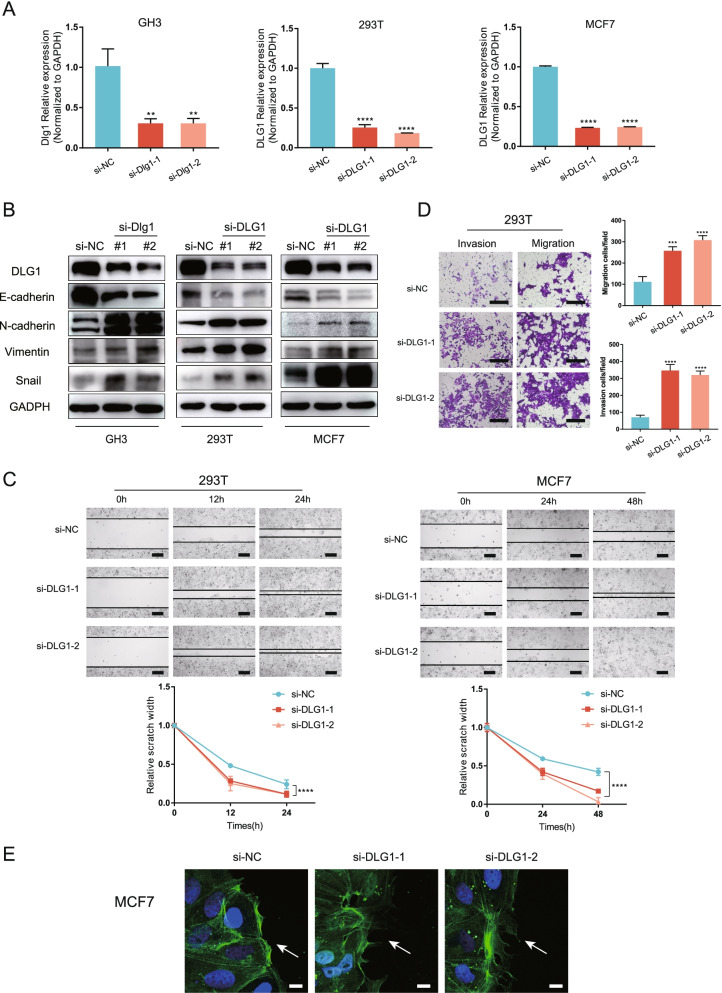
Knocking down DLG1 promoted cell migration, invasion, and EMT. A Quantitative PCR analysis of DLG1 knockdown efficiency in GH3, MCF-7, and 293 T cells. Results are expressed as mean ± SD; P values by one-way ANOVA compared with control (si-NC). B DLG1 knockdown significantly increased N-cadherin, Vimentin, and Snail expression but decreased E-cadherin expression in GH3, MCF-7, and 293 T cells. C Scratch assay of 293 T and MCF7 cells with or without DLG1 siRNA; scale bar: 200 μm. Relative scratch width over time shown below (n = 3; mean ± SD shown below; P values by two-way ANOVA). D Transwell assay of 293 T cells transfected with negative control (si-NC) and si-DLG1; scale bar: 200 μm. Data are presented as the mean ± SD from three independent experiments. P values by one-way ANOVA; **P < 0.01; ***P < 0.001; ****P < 0.0001, relative to control (si-NC). E Confocal immunofluorescence images in wound healing migration assays of MCF7 cells. After transfection with siRNAs for 48 h, MCF7 cells were scratched to allow cell migration. Cells were fixed after migrating for 12 h, and then stained with phalloidin (green) and DAPI (blue) to reveal F actin and nuclei, respectively; scale bar: 50 μm

